In a previous post, I looked at scores from the National Assessment of Educational Progress (NAEP), which is a set of tests administered every two years. In that post, I focused on national trends, which show that reading and math scores are falling – especially among the lowest-performing students. I pointed out that while this is important to know, it’s not particularly actionable.
In this post, I will explore state-level data, looking at trends in my home state of Minnesota, as well as for Mississippi and Louisiana, which are actually seeing significant improvement in their scores.
State Trends Over Time
Recapping observations from my previous post, at a national level:
- 10th percentile scores are rapidly declining in both reading and math.
- 50th percentile scores are declining in reading and roughly flat in math.
- 90th percentile scores are flat in reading and slightly rising in math.
However, NAEP data allows us to see trends for each individual state. Let’s start by looking at 4th grade reading and math. I am highlighting three states (Minnesota, Mississippi, and Louisiana), as well as the national trend.
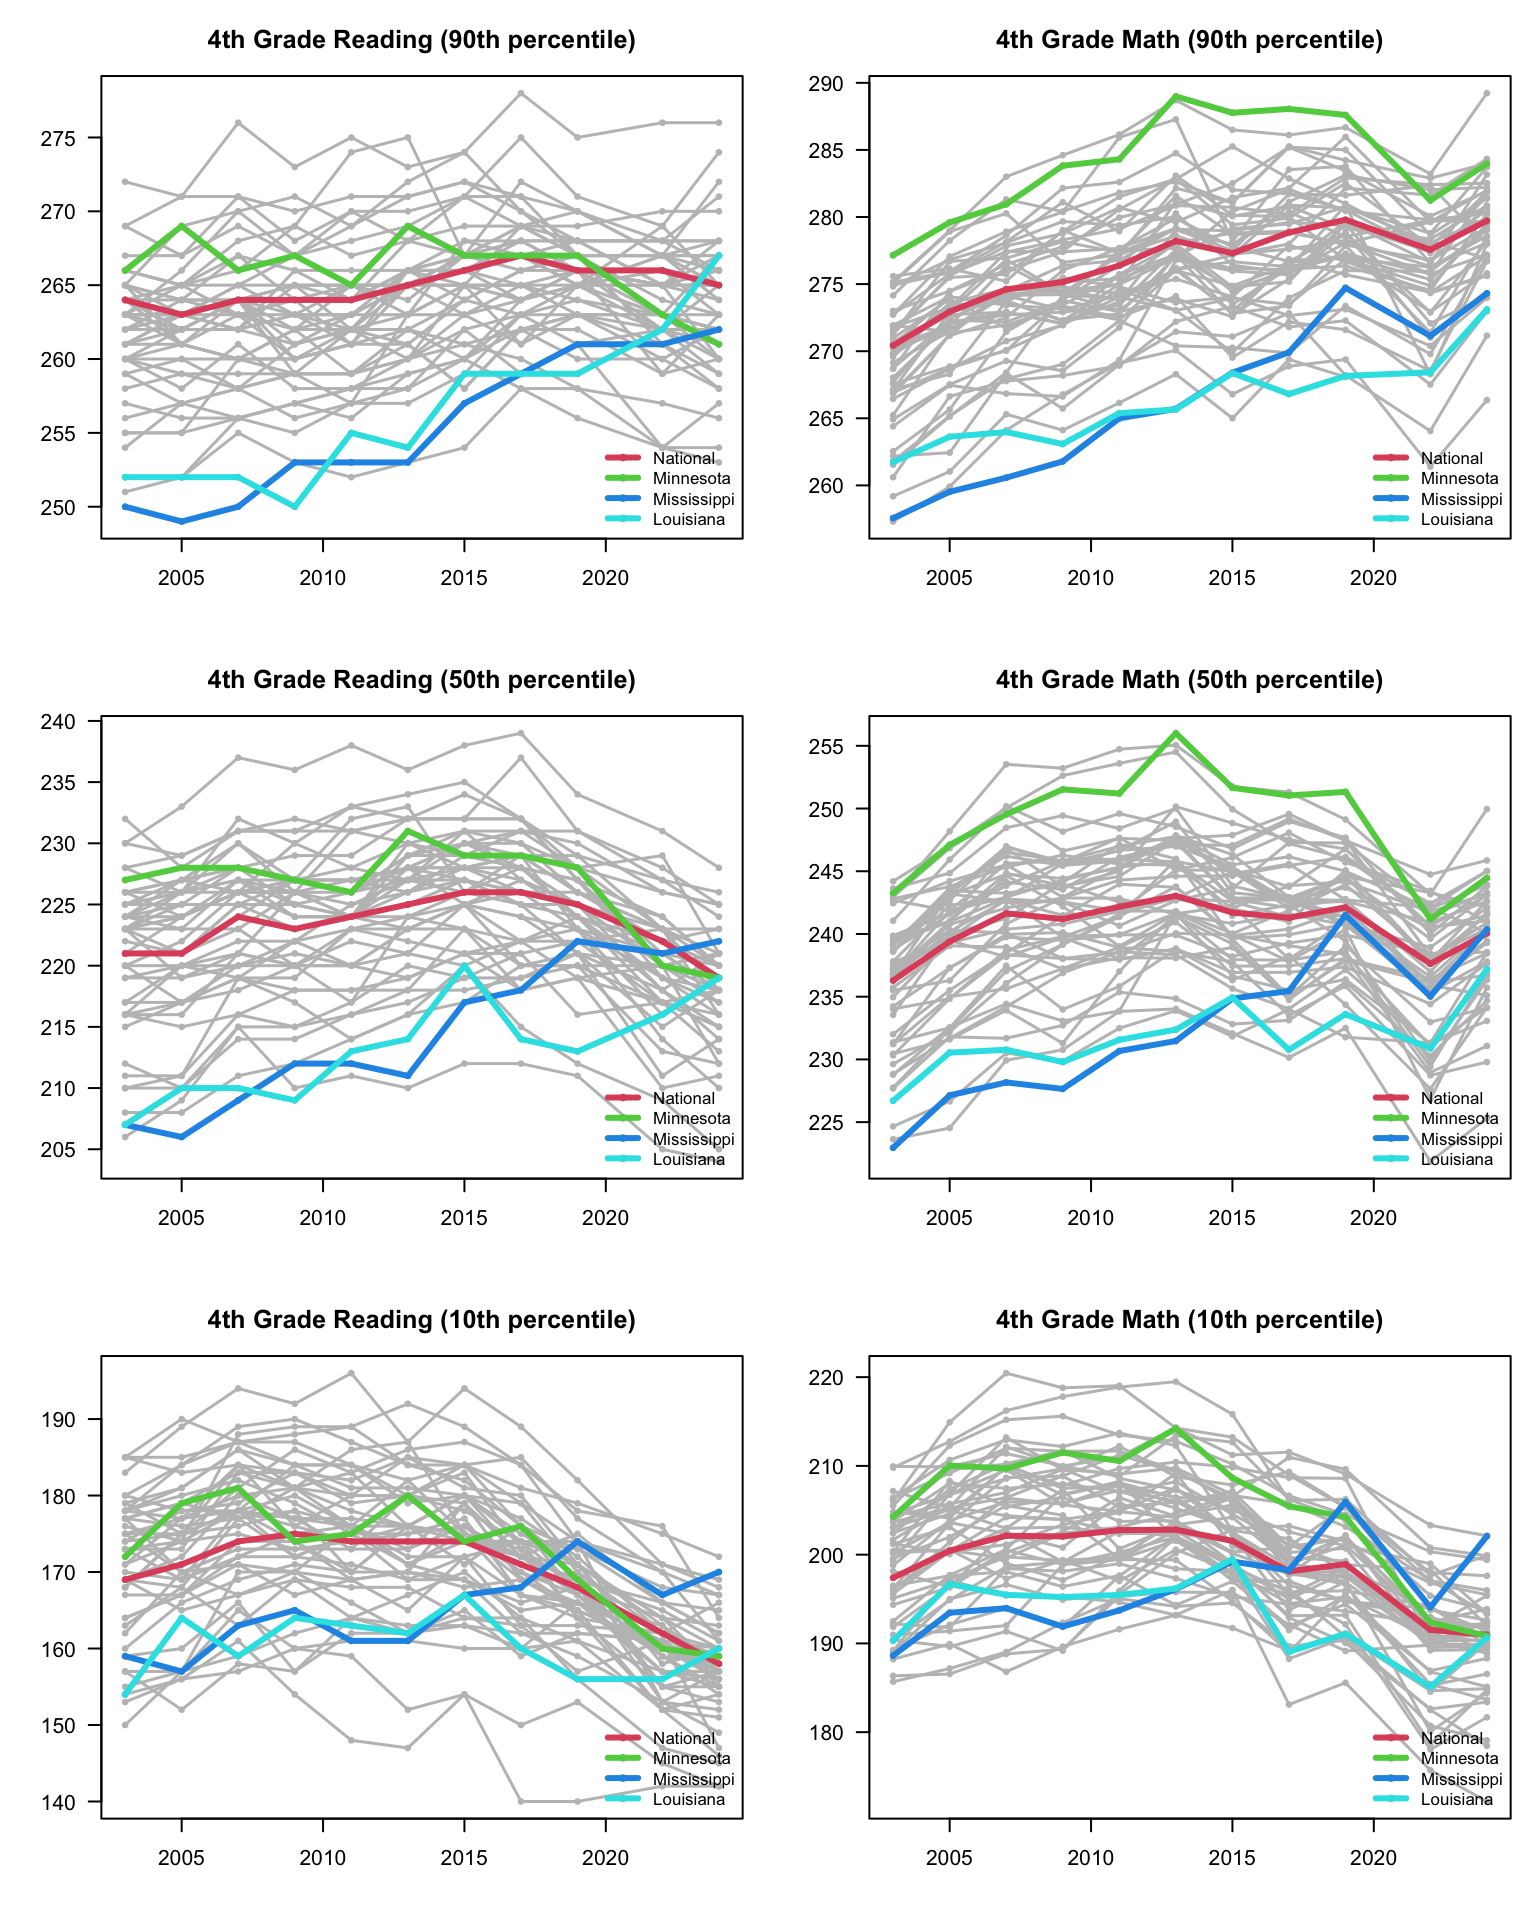
In 2003, Minnesota had some of the highest reading scores in the country, and Mississippi and Louisiana the lowest. However, Minnesota’s trend lines are all decreasing, while Mississippi and Louisiana show significant gains in both subjects at the 90th and 50th percentiles (with modest to no gains at the 10th percentile). Both of these states have now passed Minnesota in reading, which has fallen to around the national average.
The charts above are actually somewhat unfair to Mississippi and Louisiana, which have more low-income students and students of color than Minnesota does. The Urban Institute makes an effort to adjust these scores for state demographics, to make a more “apples to apples” comparison. The effects of this adjustment are shown below.
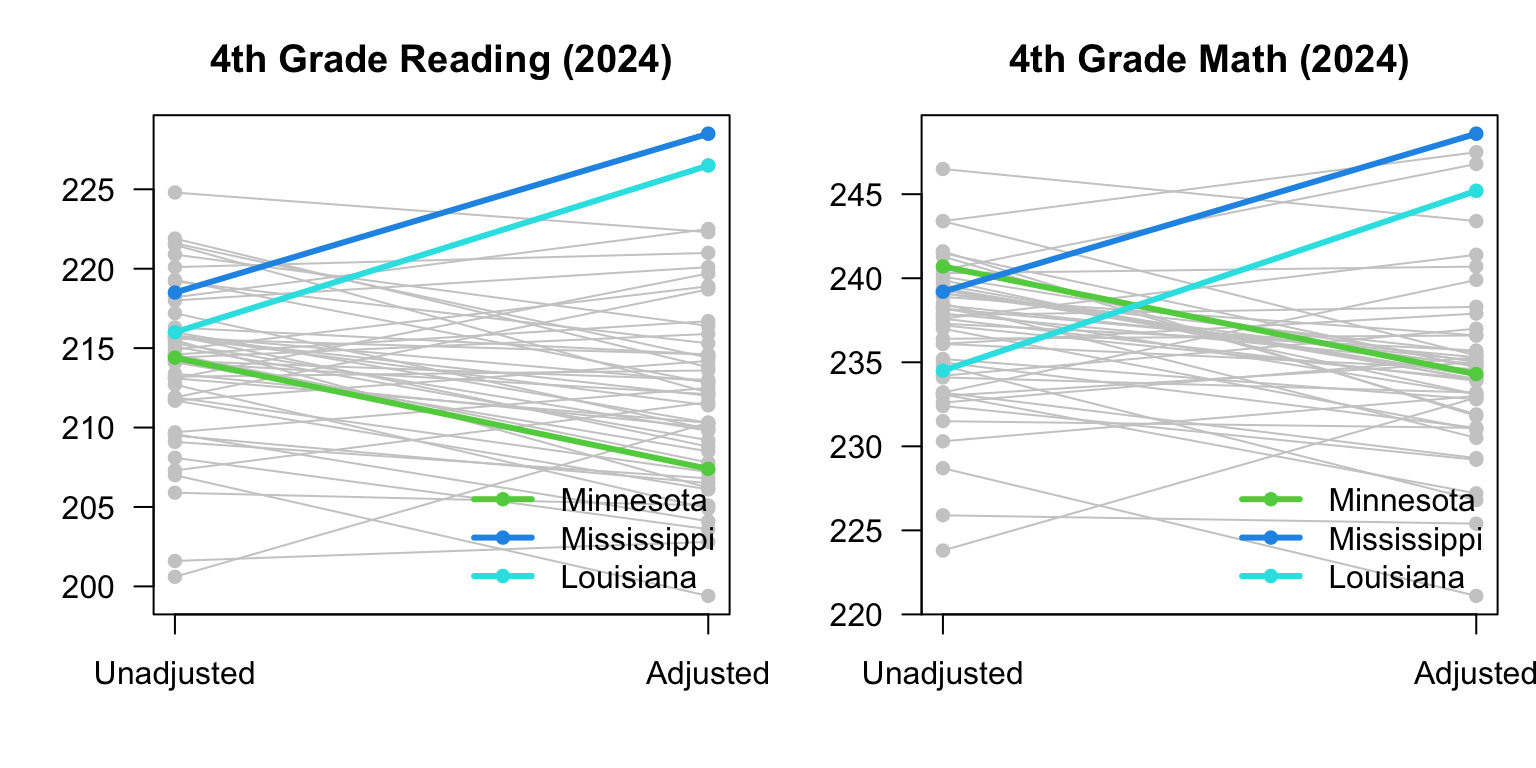
After adjustment, Mississippi and Louisiana top the nation in reading (and both are top 4 in math). Minnesota lags far behind. For context, students gain an average of 10 or so points per year, so this shows that after adjusting for demographics, Minnesota 4th graders are about one year behind those in Mississippi and Louisiana in math, and two years behind in reading.
(Fun trivia question, unrelated to the rest of the post: there is one other state that sees gains from adjustment that are similarly large to those in Mississippi and Louisiana. This state starts at the bottom of the unadjusted data. Which state is it?)
What’s Going on in Mississippi?
Mississippi now tops the country in demographic-adjusted 4th grade reading scores. This fact has been covered by the press, and often titled the “Mississippi Miracle.” What is Mississippi doing right?
We can’t know for sure, but many point to the 2013 Literacy-Based Promotion Act, which implemented many reforms, including the following:
- Mandatory training in phonics for K-3 teachers.
- Early Screening, 3x per year in grades K-3 to identify students that are behind.
- Individual reading plans for students who are behind.
- Literacy coaches deployed to schools.
- Mandatory retention (repeating 3rd grade) for 3rd graders who do not score well enough on a statewide literacy exam.
As far as I can tell, the state really means business. For example, the original literacy training for teachers, LETRS, typically took 140-160 hours to complete. Importantly, this training was tied to specific curriculum. The training has recently been replaced with a more streamlined training that requires “only” 50 hours. Meanwhile, the retention policy has bite: in recent years, 6-10% of 3rd graders repeat the grade.
There’s not a corresponding policy that would directly explain the rise in 4th grade math scores. However, math tests require some amount of reading ability, so it makes some sense that improved literacy should have positive effects on math as well.
A variety of skeptics have doubted the validity or relevance of Mississippi’s gains. In preparing to write this post, I read a lot of articles – both admiring and skeptical – about Mississippi. Almost all of the skeptical articles showed incredibly sloppy thinking, accompanied by a lot of condescension towards the south. These takes were so bad that I got sidetracked into writing an entire other post about how bad they were. But I will try to keep this post data-oriented, and briefly address several common critiques.
Racial achievement gaps remain large.
The retention policy unfairly skews the data.
8th grade scores have not shown the same gains.
Racial Achievement Gaps Persist
This post notes that
Mississippi’s Black and Hispanic fourth-graders still scored much lower than white children — and the gap had not changed over the 10 years of the new regime. In fact, [the gap between black and white students] widened to 28 percentage points in 2022 from 25 points in 2013. The same thing happened with Hispanic pupils, who fell short of white kids’ achievement by 22 points in 2022 versus 21 in 2013.
It’s true that Black kids in Mississippi are still behind their white counterparts (in Mississippi and across the country). But the focus on achievement gaps distracts from absolute achievement levels, which are a much better way to assess a policy. Over the past two decades, both white and black students in Mississippi have seen their reading scores rise significantly. This is a good thing! We should celebrate policies that raise performance of all groups, regardless of whether they close gaps.
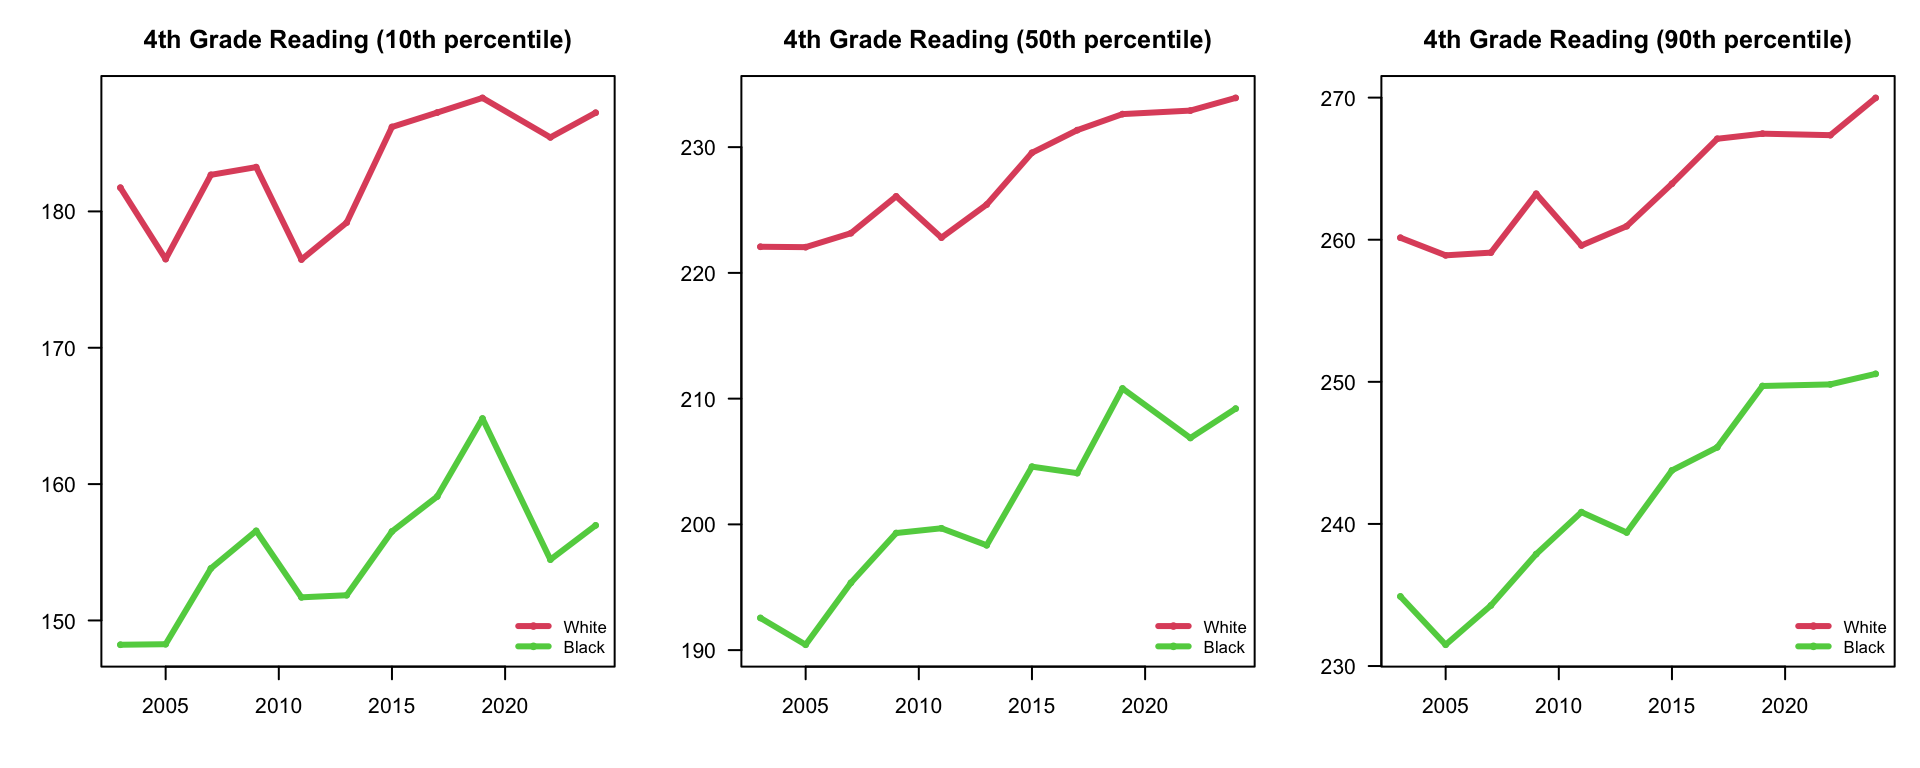
It is also worth noting that black students in Mississippi are performing above black students nationally (and in Minnesota). The same is true for low income students, as shown in the tables below.
Outcomes for Black students (4th grade reading, 2024)
| Advanced | Proficient or above | Basic or above | Below basic | 90th percentile | 50th percentile | 10th percentile | |
|---|---|---|---|---|---|---|---|
| Mississippi | 2 | 19 | 52 | 48 | 251 | 209 | 157 |
| National | 3 | 17 | 44 | 56 | 249 | 202 | 145 |
| Minnesota | 3 | 17 | 42 | 58 | 248 | 199 | 133 |
Outcomes for Economically Disadvantaged students (4th grade reading, 2024)
| Advanced | Proficient or above | Basic or above | Below basic | 90th percentile | 50th percentile | 10th percentile | |
|---|---|---|---|---|---|---|---|
| Mississippi | 4 | 24 | 58 | 42 | 256 | 215 | 164 |
| National | 4 | 19 | 47 | 53 | 252 | 205 | 147 |
| Minnesota | 2 | 16 | 43 | 57 | 246 | 200 | 142 |
It remains true that many students in Mississippi are still not proficient in reading: there’s more work to be done. But the presence of race gaps does not change the fact that all students in Mississippi are seeing their scores improve.
The Retention Policy Skews the Data
This argument has been presented in two forms.The first is succinctly stated by this article, which explains
It is a fact of arithmetic that the mean score of any data set always increases if you delete some of the lowest scores.
The point the authors are making is that if you take out the 10% lowest scores (because these students have been held back in 3rd grade), then of course average scores in 4th grade will improve. However, the authors’ analysis assumes that students who are held back in 3rd grade are permanently expelled from the school district, never to be seen again. In fact, they don’t disappear – they appear in 4th grade one year later!
The smarter version of this concern is that retention causes kids to be older when they take the test. To consider an extreme case, suppose that every child was held back in 3rd grade. Then Mississippi’s 4th graders would be a full year older than 4th graders everywhere else, which could explain their superior performance.
Although Mississippi holds back more students than other states, there are several reasons I don’t think this explains Mississippi’s improved test scores. One is simple “back of the envelope” reasoning. Examining our earlier charts, the median 4th grade reading score in Mississippi rose 11 points from 2013 to 2024. As I discuss in my previous post, student scores rise by approximately 10 points per year, so in order for the gains to be explained by a rise in the age of test takers, 4th graders in Mississippi would have to be a full year older than they were in 2013.1 That’s not going to be the case with retention rates of 7-10%. In fact, this blog post by Kevin Drum claims that Mississippi has always had high retention rates, and that in the years right after implementation of the retention policy, average age of fourth graders did not rise. I haven’t independently verified this, and his data stopped in 2017, so this is not fully convincing. But the Urban Institute includes adjustments for age (measured in months), so if Mississippi’s 4th graders were dramatically older than other students, that should be accounted for in the adjusted figures shown above, where Mississippi ranks first in the country.
Stagnant 8th Grade Scores
Although Missisippi scores well on 4th grade tests, its 8th grade numbers are less impressive.
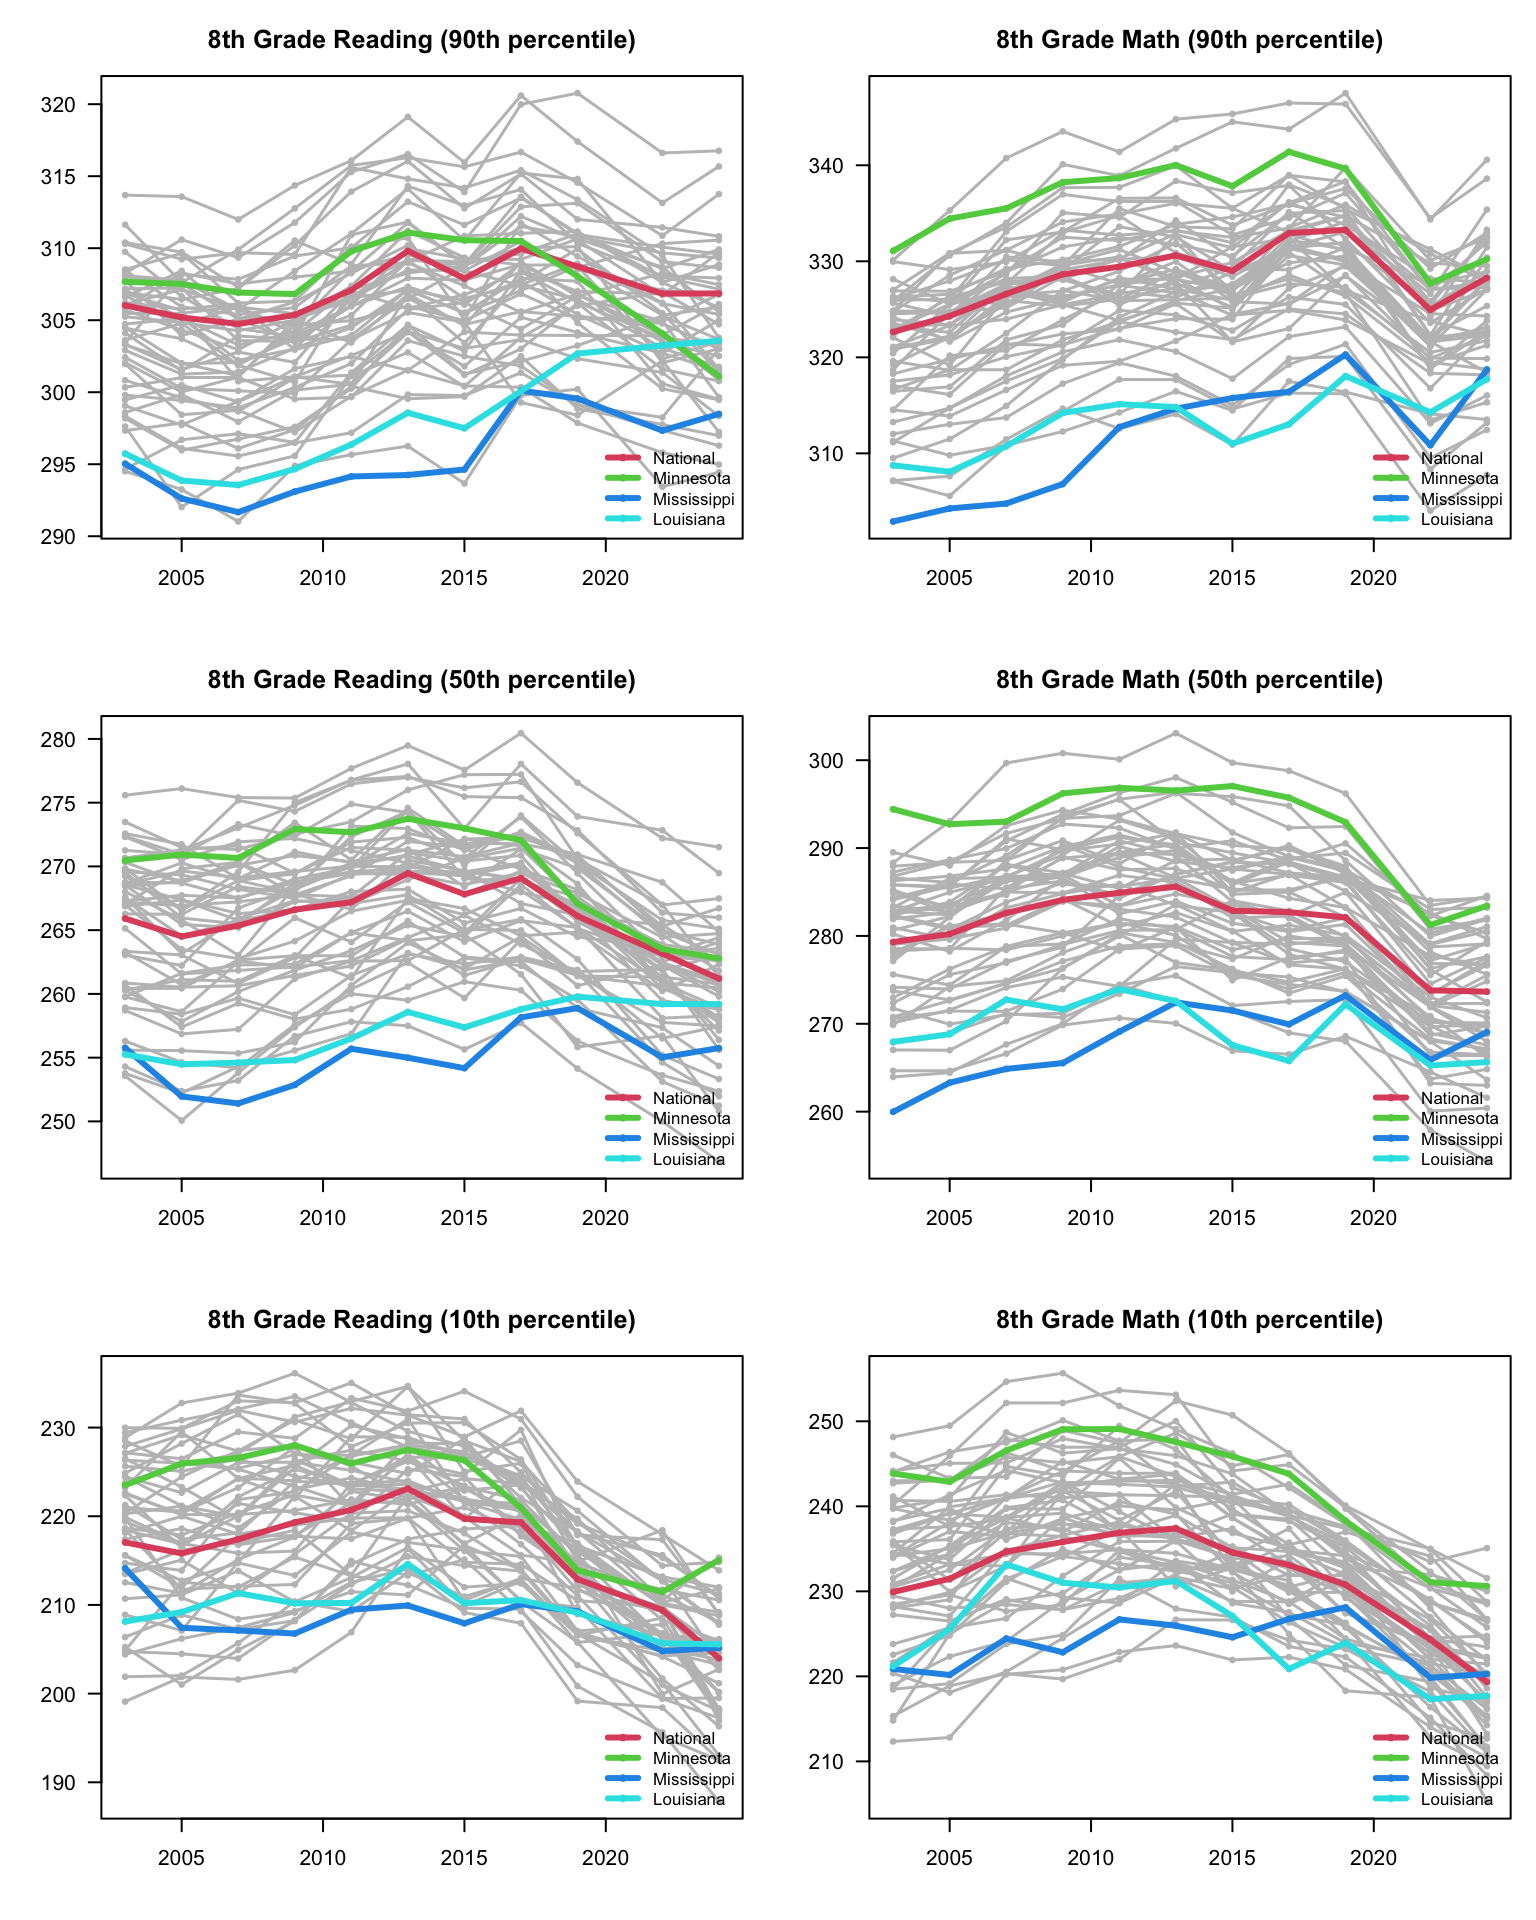
Critics point to this as evidence that the 4th grade scores are a mirage. Defenders argue that the reforms – many of which were implemented in 2015 – have not had time to “trickle up” to 8th grade. Maybe not in 2019, but certainly I would hope to see the effects by 2024! Of course, there was a pandemic during that time, and the state even removed the mandatory retention policy for a year. So the real world is messy. But looking at the data, I’m inclined to agree with the skeptics: we don’t see much evidence that the gains in fourth grade are persisting into eigth grade.
The conclusion I take from this, however, is not “Mississippi’s results are fake”, but rather “Accountability is important throughout elementary and middle school.” The 2013 literacy law focused on K-3, so most of its requirements (curriculum-oriented literacy training for teachers, 3x per year assessment of students, mandatory retention) were only for students in these grades. After that, a lot of the accountability disappeared. Perhaps its not surprising that learning disappears with it. Interestingly, just last mont (April 2026), Mississippi passed a law that will require 4-8 grade teachers to go through literacy training and to administer 3 exams to students each year to identify those that are struggling. Unlike the earlier law, there is no mandatory retension for older students. But still, it will be interesting to see in the coming years whether these interventions can improve 8th grade outcomes.
What’s Going on in Minnesota?
Why are Minnesota’s scores falling so dramatically? The short answer is, I don’t know. One thought (based on my informal observations in the Twin Cities) is that there are more recent immigrants and English Language Learners than there used to be. Could changing demographics explain the decline in scores? If so, we might expect to see lines for each demographic group that remain roughly flat, while the overall trend line (shown in red below) declines due to increased representation of low-performing groups. Let’s take a look.
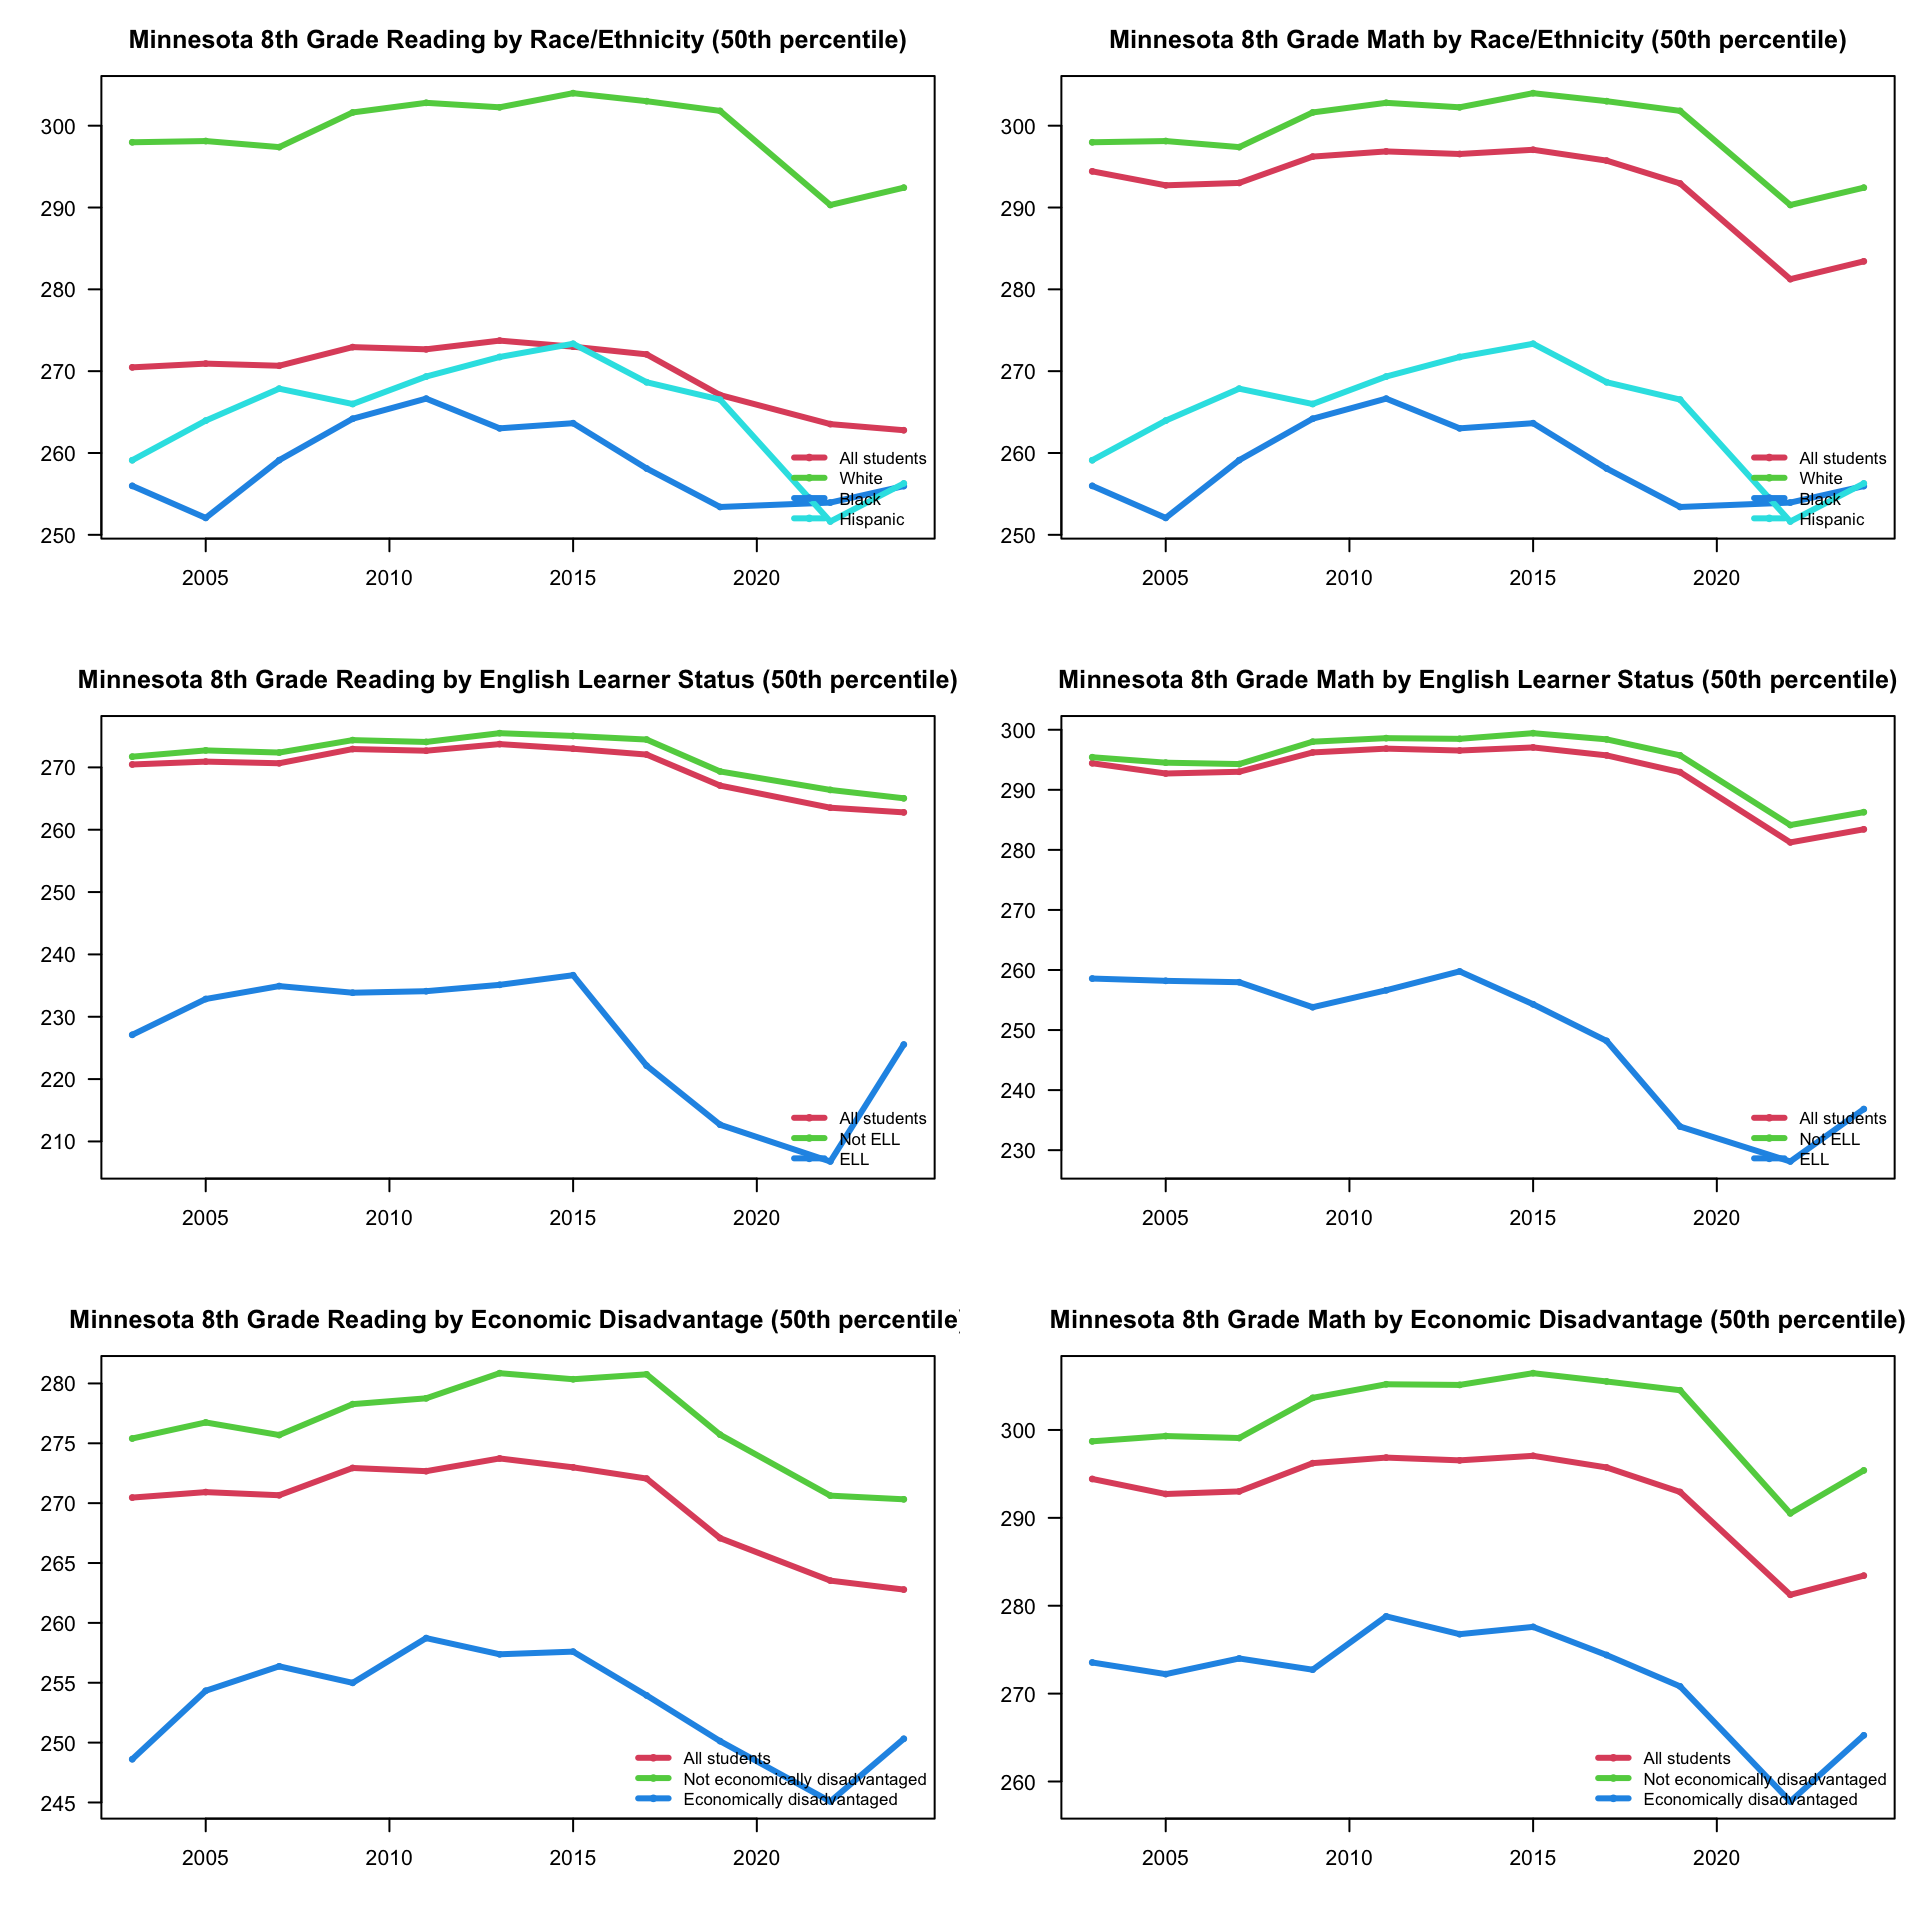
I don’t know about you, but these charts just look like a bunch of wiggly lines to me.2 In regards to English Learner status, I was surprised at how closely the red line (all students) stays to the green line (non ELL students). In other words, while the proportion of ELL students has risen over time, it remains a pretty small fraction of the statewide total, and thus is not likely driving the statewide trend. The trend lines for other demographics maybe (maybe?) look slightly flatter than the statewide average in red, but the lines don’t have dramatically different trends. In other words, I haven’t done careful statistical analysis, but nothing “jumps off the page.” I conclude that changing demographics might contribute a bit to Minnesota’s downward trend, but don’t really explain it.
My Take
I have not been to Mississippi, or talked to educators there. Nor have I done the careful data analysis that folks at the Urban Institute (presumably) have. I can’t say anything fully conclusive about what we should learn from Mississippi. But Mississippi’s improvements pass my “smell test”, for several reasons.
First, the data speaks for itself, and the critical takes questioning that data were not very persuasive (to put it mildly).
Second, the reforms sound directionaly correct to me. I think that good professional development can be very impactful – but that professional development must be closely tied to curriculum in order to actually be useful. (There may be occasional exceptions related to topics like classroom management.) The 3rd grade retention policy also makes sense to me, as a way of ensuring that somebody is actually accountable for outcomes. Every teacher (certainly including me!) knows that there are some students that they are not effectively reaching. I think too often, it’s easy to figure, “hopefully they patch the gaps in their understanding with the next teacher.” This policy communicates to teachers and administrators that it really is their job to try to help every student. I agree with this article, which states,
A fixed, public promotion standard is one of the most effective tools we’ve found to change the actions of adults. Retention policy may or may not be effective for the kids who repeat a grade, but it is very effective in getting adults – teachers, administrators, even parents – to focus their attention and change their behavior. The prospect of student retention forces all these adults to come to grips with the fact that a child they care deeply about is significantly behind in one of the most crucial areas of their education.
A third reason that I believe in Mississippi’s gains is that, while very significant, they are no miracle. There are still many students struggling to reach proficiency in Mississippi. Outcomes are above national averages, but not by crazy margins. Scores in Mississippi have been gradually improving for a long time. This is not about some sudden leap that happened in a single year of data. Mississippi is no miracle, but I believe that it should be an example for other states to learn from.
Code
For those interested in conducting their own analysis (or auditing mine), I am including the R code that I used to generate the figures above (written with significant assistance from ChatGPT). I am also linking to raw data files with state-level scores for 4th grade reading, 8th grade reading, 4th grade math and 8th grade math.
Loading the data:
library(readxl)
reading_4th = read_excel("../../static/Data/NAEP/NAEP_Reading_4th_State.xlsx")
reading_8th = read_excel("../../static/Data/NAEP/NAEP_Reading_8th_State.xlsx")
math_4th = read_excel("../../static/Data/NAEP/NAEP_Math_4th_State.xlsx")
math_8th = read_excel("../../static/Data/NAEP/NAEP_Math_8th_State.xlsx")
data_state = list(reading_4th,math_4th,reading_8th,math_8th)
data_names = c("4th Grade Reading","4th Grade Math","8th Grade Reading","8th Grade Math")
Generic code for plotting trajectories:
plot_naep_trajectories <- function(
  df,
  value_col,
  line_col = "Jurisdiction",
  filter = list(),
  lines_to_plot = NULL,
  start_year = -Inf,
  exclude_lines = character(0),
  highlight_lines = character(0),
  highlight_cols = NULL,
  main = NULL,
  ylim = NULL,
  legend_pos = "bottomright",
  show_legend = TRUE,
  gray_col = "gray75",
  lwd_default = 1.5,
  lwd_highlight = 3,
  pch = 16
) {
  df <- as.data.frame(df, stringsAsFactors = FALSE)

  needed <- c("Year", line_col, value_col)
  missing <- setdiff(needed, names(df))
  if (length(missing) > 0) {
    stop("Missing column(s): ", paste(missing, collapse = ", "))
  }

  df$Year <- suppressWarnings(as.numeric(df$Year))

  for (nm in names(filter)) {
    if (!(nm %in% names(df))) stop("Filter column not found: ", nm)
    df <- df[df[[nm]] %in% filter[[nm]], ]
  }

  df <- df[df$Year >= start_year, ]

  # Treat NULL or character(0) as "plot all lines"
  if (!is.null(lines_to_plot) && length(lines_to_plot) > 0) {
    df <- df[df[[line_col]] %in% lines_to_plot, ]
  }

  df <- df[!(df[[line_col]] %in% exclude_lines), ]

  df[[value_col]] <- suppressWarnings(as.numeric(df[[value_col]]))
  df <- df[is.finite(df$Year) & is.finite(df[[value_col]]), ]

  if (nrow(df) == 0) {
    stop(
      "No usable data left after filtering. Check filter, lines_to_plot, ",
      "start_year, and value_col = '", value_col, "'."
    )
  }

  line_names <- unique(df[[line_col]])
  if (length(line_names) == 0) {
    stop("No lines found in column: ", line_col)
  }

  xlim <- range(df$Year, na.rm = TRUE)

  if (is.null(ylim)) {
    ylim <- range(df[[value_col]], na.rm = TRUE)
  }

  if (!all(is.finite(xlim))) {
    stop("Bad x-axis limits. Is Year numeric?")
  }

  if (!all(is.finite(ylim))) {
    stop(
      "Bad y-axis limits. Column '", value_col,
      "' may be entirely missing, suppressed, or nonnumeric after filtering."
    )
  }

  if (is.null(main)) {
    main <- value_col
  }

  plot(
    NA,
    xlim = xlim,
    ylim = ylim,
    xlab = "",
    ylab = "",
    main = main,
    las=1
  )

  if (is.null(highlight_cols)) {
    highlight_cols <- seq_along(highlight_lines) + 1
    names(highlight_cols) <- highlight_lines
  } else if (is.null(names(highlight_cols))) {
    names(highlight_cols) <- highlight_lines[seq_along(highlight_cols)]
  }

  # First pass: plot every line in gray
  for (ln in line_names) {
    d <- df[df[[line_col]] == ln, ]
    d <- d[order(d$Year), ]

    lines(d$Year, d[[value_col]], col = gray_col, lwd = lwd_default)
    points(d$Year, d[[value_col]], col = gray_col, pch = pch, cex = 0.7)
  }

  # Second pass: plot highlighted lines again, in color
  legend_lines <- intersect(highlight_lines, line_names)

  for (ln in legend_lines) {
    d <- df[df[[line_col]] == ln, ]
    d <- d[order(d$Year), ]

    col <- unname(highlight_cols[ln])

    lines(d$Year, d[[value_col]], col = col, lwd = lwd_highlight)
    points(d$Year, d[[value_col]], col = col, pch = pch, cex = 0.7)
  }

  if (show_legend && length(legend_lines) > 0) {
    legend(
      legend_pos,
      legend = legend_lines,
      col = unname(highlight_cols[legend_lines]),
      lwd = lwd_highlight,
      pch = pch,
      bty = "n",
      cex = 0.8
    )
  }

  invisible(df)
}
Code to plot trajectories for 4th and 8th graders, highlighting selected states:
columns = c("10th percentile","50th percentile","90th percentile")
states_to_highlight = c("National","Minnesota","Mississippi","Louisiana")
states_to_remove = c("Puerto Rico","District of Columbia","DoDEA")

par(mfrow = c(3, 2), mar = c(4, 4, 3, 1))
for(i in 3:1){
  for(j in 1:2){
    plot_naep_trajectories(
      data_state[[j]],
      value_col = columns[i],
      start_year = 2003,
      line_col = "Jurisdiction",
      highlight_lines = states_to_highlight,
      exclude_lines = states_to_remove,
      main = paste(data_names[j]," (",columns[i],")",sep="")
    )
  }
}
par(mfrow = c(3, 2), mar = c(4, 4, 3, 1))
for(i in 3:1){
for(j in 3:4){
plot_naep_trajectories(
data_state[[j]],
value_col = columns[i],
start_year = 2003,
line_col = "Jurisdiction",
highlight_lines = states_to_highlight,
exclude_lines = states_to_remove,
main = paste(data_names[j]," (",columns[i],")",sep="")
)
}
}Code to load and plot adjusted NAEP scores calculated by the Urban Institute (raw data here):
read_naep_adjusted <- function(file) {
  raw <- read.csv(file, header = FALSE, check.names = FALSE, stringsAsFactors = FALSE)

  block <- as.character(raw[1, ])
  sub   <- as.character(raw[2, ])

  block[1] <- "Jurisdiction"
  for (j in 2:length(block)) {
    if (is.na(block[j]) || block[j] == "" || grepl("^X\\.", block[j])) {
      block[j] <- block[j - 1]
    }
  }

  nm <- ifelse(
    seq_along(sub) == 1,
    "Jurisdiction",
    paste(gsub("~", "", block), sub, sep = " | ")
  )

  df <- raw[-c(1, 2), ]
  names(df) <- nm
  rownames(df) <- NULL

  df
}

plot_naep_adjusted_pairs <- function(
  df,
  col_left,
  col_right,
  highlight_states = character(0),
  exclude_states = character(0),
  legend_pos = "bottomright",
  main = NULL,
  background_col = "gray80",
  highlight_cols = NULL,
  background_lwd = 1,
  highlight_lwd = 3,
  left_label = col_left,
  right_label = col_right
) {
  df <- as.data.frame(df, stringsAsFactors = FALSE)

  if (!("Jurisdiction" %in% names(df))) stop("'Jurisdiction' column is required.")
  if (!(col_left %in% names(df))) stop(sprintf("Column '%s' not found.", col_left))
  if (!(col_right %in% names(df))) stop(sprintf("Column '%s' not found.", col_right))

  state <- df$Jurisdiction
  left  <- suppressWarnings(as.numeric(df[[col_left]]))
  right <- suppressWarnings(as.numeric(df[[col_right]]))

  keep <- !is.na(state) & !is.na(left) & !is.na(right)

  df2 <- data.frame(
    Jurisdiction = state[keep],
    Left = left[keep],
    Right = right[keep],
    stringsAsFactors = FALSE
  )

  if (length(exclude_states) > 0) {
    df2 <- df2[!(df2$Jurisdiction %in% exclude_states), ]
  }

  dup <- duplicated(df2$Jurisdiction)
  if (any(dup)) stop("Data must contain at most one row per Jurisdiction.")

  if (nrow(df2) == 0) stop("No data left after filtering.")

  if (is.null(main)) main <- paste(col_left, "vs", col_right)

  ylim <- range(c(df2$Left, df2$Right), na.rm = TRUE)

  plot(NA, xlim = c(1, 2), ylim = ylim, xaxt = "n",
       xlab = "", ylab = "", main = main, las = 1)
  axis(1, at = c(1, 2), labels = c(left_label, right_label))

  for (i in seq_len(nrow(df2))) {
    segments(1, df2$Left[i], 2, df2$Right[i],
             col = background_col, lwd = background_lwd)
    points(c(1, 2), c(df2$Left[i], df2$Right[i]),
           pch = 16, col = background_col)
  }

  hs <- intersect(highlight_states, df2$Jurisdiction)
  missing <- setdiff(highlight_states, hs)
  if (length(missing) > 0) {
    warning("Jurisdictions not found: ", paste(missing, collapse = ", "))
  }

  if (length(hs) > 0) {
    if (is.null(highlight_cols)) {
      highlight_cols <- seq_along(hs) + 1L
    }

    for (i in seq_along(hs)) {
      d <- df2[df2$Jurisdiction == hs[i], ]
      segments(1, d$Left, 2, d$Right, col = highlight_cols[i], lwd = highlight_lwd)
      points(c(1, 2), c(d$Left, d$Right), pch = 16, col = highlight_cols[i])
    }

    legend(legend_pos, legend = hs, col = highlight_cols, lwd = highlight_lwd,
           pch = 16, bty = "n")
  }

  invisible(df2)
}

clean_name <- function(x) {
  sub(" ", "-", tolower(x), fixed = TRUE)
}

adj <- read_naep_adjusted("../../static/Data/NAEP/NAEP_DemographicAdjusted.csv")
yr = 2024

par(mfrow = c(1, 2), mar = c(4, 4, 3, 1))
for(i in 1:2)
plot_naep_adjusted_pairs(
  adj,
  col_left  = paste(clean_name(data_names[i])," | ",yr," unadjusted",sep=""),
  col_right = paste(clean_name(data_names[i])," | ",yr," adjusted",sep=""),
  highlight_states = states_to_highlight[-1],
  highlight_cols = c(3:5),
  exclude_states = c(),
  main = paste(data_names[i]," (",yr,")",sep=""),
  left_label = "Unadjusted",
  right_label = "Adjusted"
)
Code to load and plot NAEP scores by demographic group (raw data for selected states available for 4th grade reading, 8th grade reading, 4th grade math and 8th grade math; for other states, see the NAEP data explorer)
reading_4th_demographics = read_excel("../../static/Data/NAEP/NAEP_Reading_4th_Demographics.xlsx")
reading_8th_demographics = read_excel("../../static/Data/NAEP/NAEP_Reading_8th_Demographics.xlsx")
math_4th_demographics = read_excel("../../static/Data/NAEP/NAEP_Math_4th_Demographics.xlsx")
math_8th_demographics = read_excel("../../static/Data/NAEP/NAEP_Math_8th_Demographics.xlsx")

data_demographics = list(reading_4th_demographics,math_4th_demographics,reading_8th_demographics,math_8th_demographics)

race = c("All students","White","Black","Hispanic")
ell = c("All students","Not ELL","ELL")
frl = c("All students","Not economically disadvantaged","Economically disadvantaged")
demographic_list = list(race,ell,frl)
demographic_names = c("Race/Ethnicity","English Learner Status", "Economic Disadvantage")
i = 2 #Which value (column) to plot; 1 = 10th, 2 = 50th, 3 = 90th
par(mfrow = c(1, 3), mar = c(4, 4, 3, 1))
for(i in 1:3){
plot_naep_trajectories(
reading_4th_demographics,
value_col = columns[i],
line_col = "Demographic",
filter = list(Jurisdiction = "Mississippi"),
lines_to_plot = c("White","Black"),
highlight_lines = c("White","Black"),
start_year = 2003,
main = paste("4th Grade Reading (",columns[i],")",sep="")
)}s = 2 #Which state to plot; 1 = National, 2 = Minnesota, 3 = Mississippi, 4 = Louisiana
#d = 3 #Which demographic category to plot 1 = Race, 2 = ELL, 3 = FRL
i = 2 #Which value (column) to plot; 1 = 10th, 2 = 50th, 3 = 90th
#j = 1 #Which grade and subject to plot; 1 = reading 4; 2 = math 4; 3 = reading 8; 4 = math 8
data_demographics = list(reading_4th_demographics,math_4th_demographics,reading_8th_demographics,math_8th_demographics)
par(mfrow = c(3, 2), mar = c(4, 4, 3, 1))
for(d in 1:3){
for(j in 3:4){
plot_naep_trajectories(
data_demographics[[j]],
value_col = columns[i],
line_col = "Demographic",
filter = list(Jurisdiction = states_to_highlight[s]),
lines_to_plot = demographic_list[[d]],
highlight_lines = demographic_list[[d]],
start_year = 2003,
main = paste(states_to_highlight[s]," ",data_names[j]," by ",demographic_names[d]," (",columns[i],")",sep="")
)
}
}Of course, there is some noise associated with the sampling procedure, so the true difference is not precisely estimated at 11, but the point I’m making remains broadly correct.↩︎
The wiggly-ness is presumably because the noise when estimating subgroup outcomes is enhanced due to a smaller sample size.↩︎