As an educator, I hear it all the time. Students are less prepared than they used to be. Curriculum is less rigorous. But is there any data to back this up?
As it turns out, there is! The National Assessment of Educational Progress (NAEP) is a set of tests given every two years to 4th, 8th and 12th graders across the country.1 These tests are sometimes called “The Nation’s Report Card,” and the resulting data are available for download.
In this post, I will focus on 4th and 8th grade reading and math, because these are subjects that almost everyone agrees are important. If you’re curious what is on the test, a bank of questions is available here.
Trends Over Time
NAEP reports results in two different ways: ‘scale scores’ from 0-500, and ‘Achievement Levels’ (Advanced, Proficient, Basic and Below Basic).2 Let’s look at scale scores first. The following charts show how 10th, 25th, 50th, 75th, and 90th percentile scores have evolved over time.
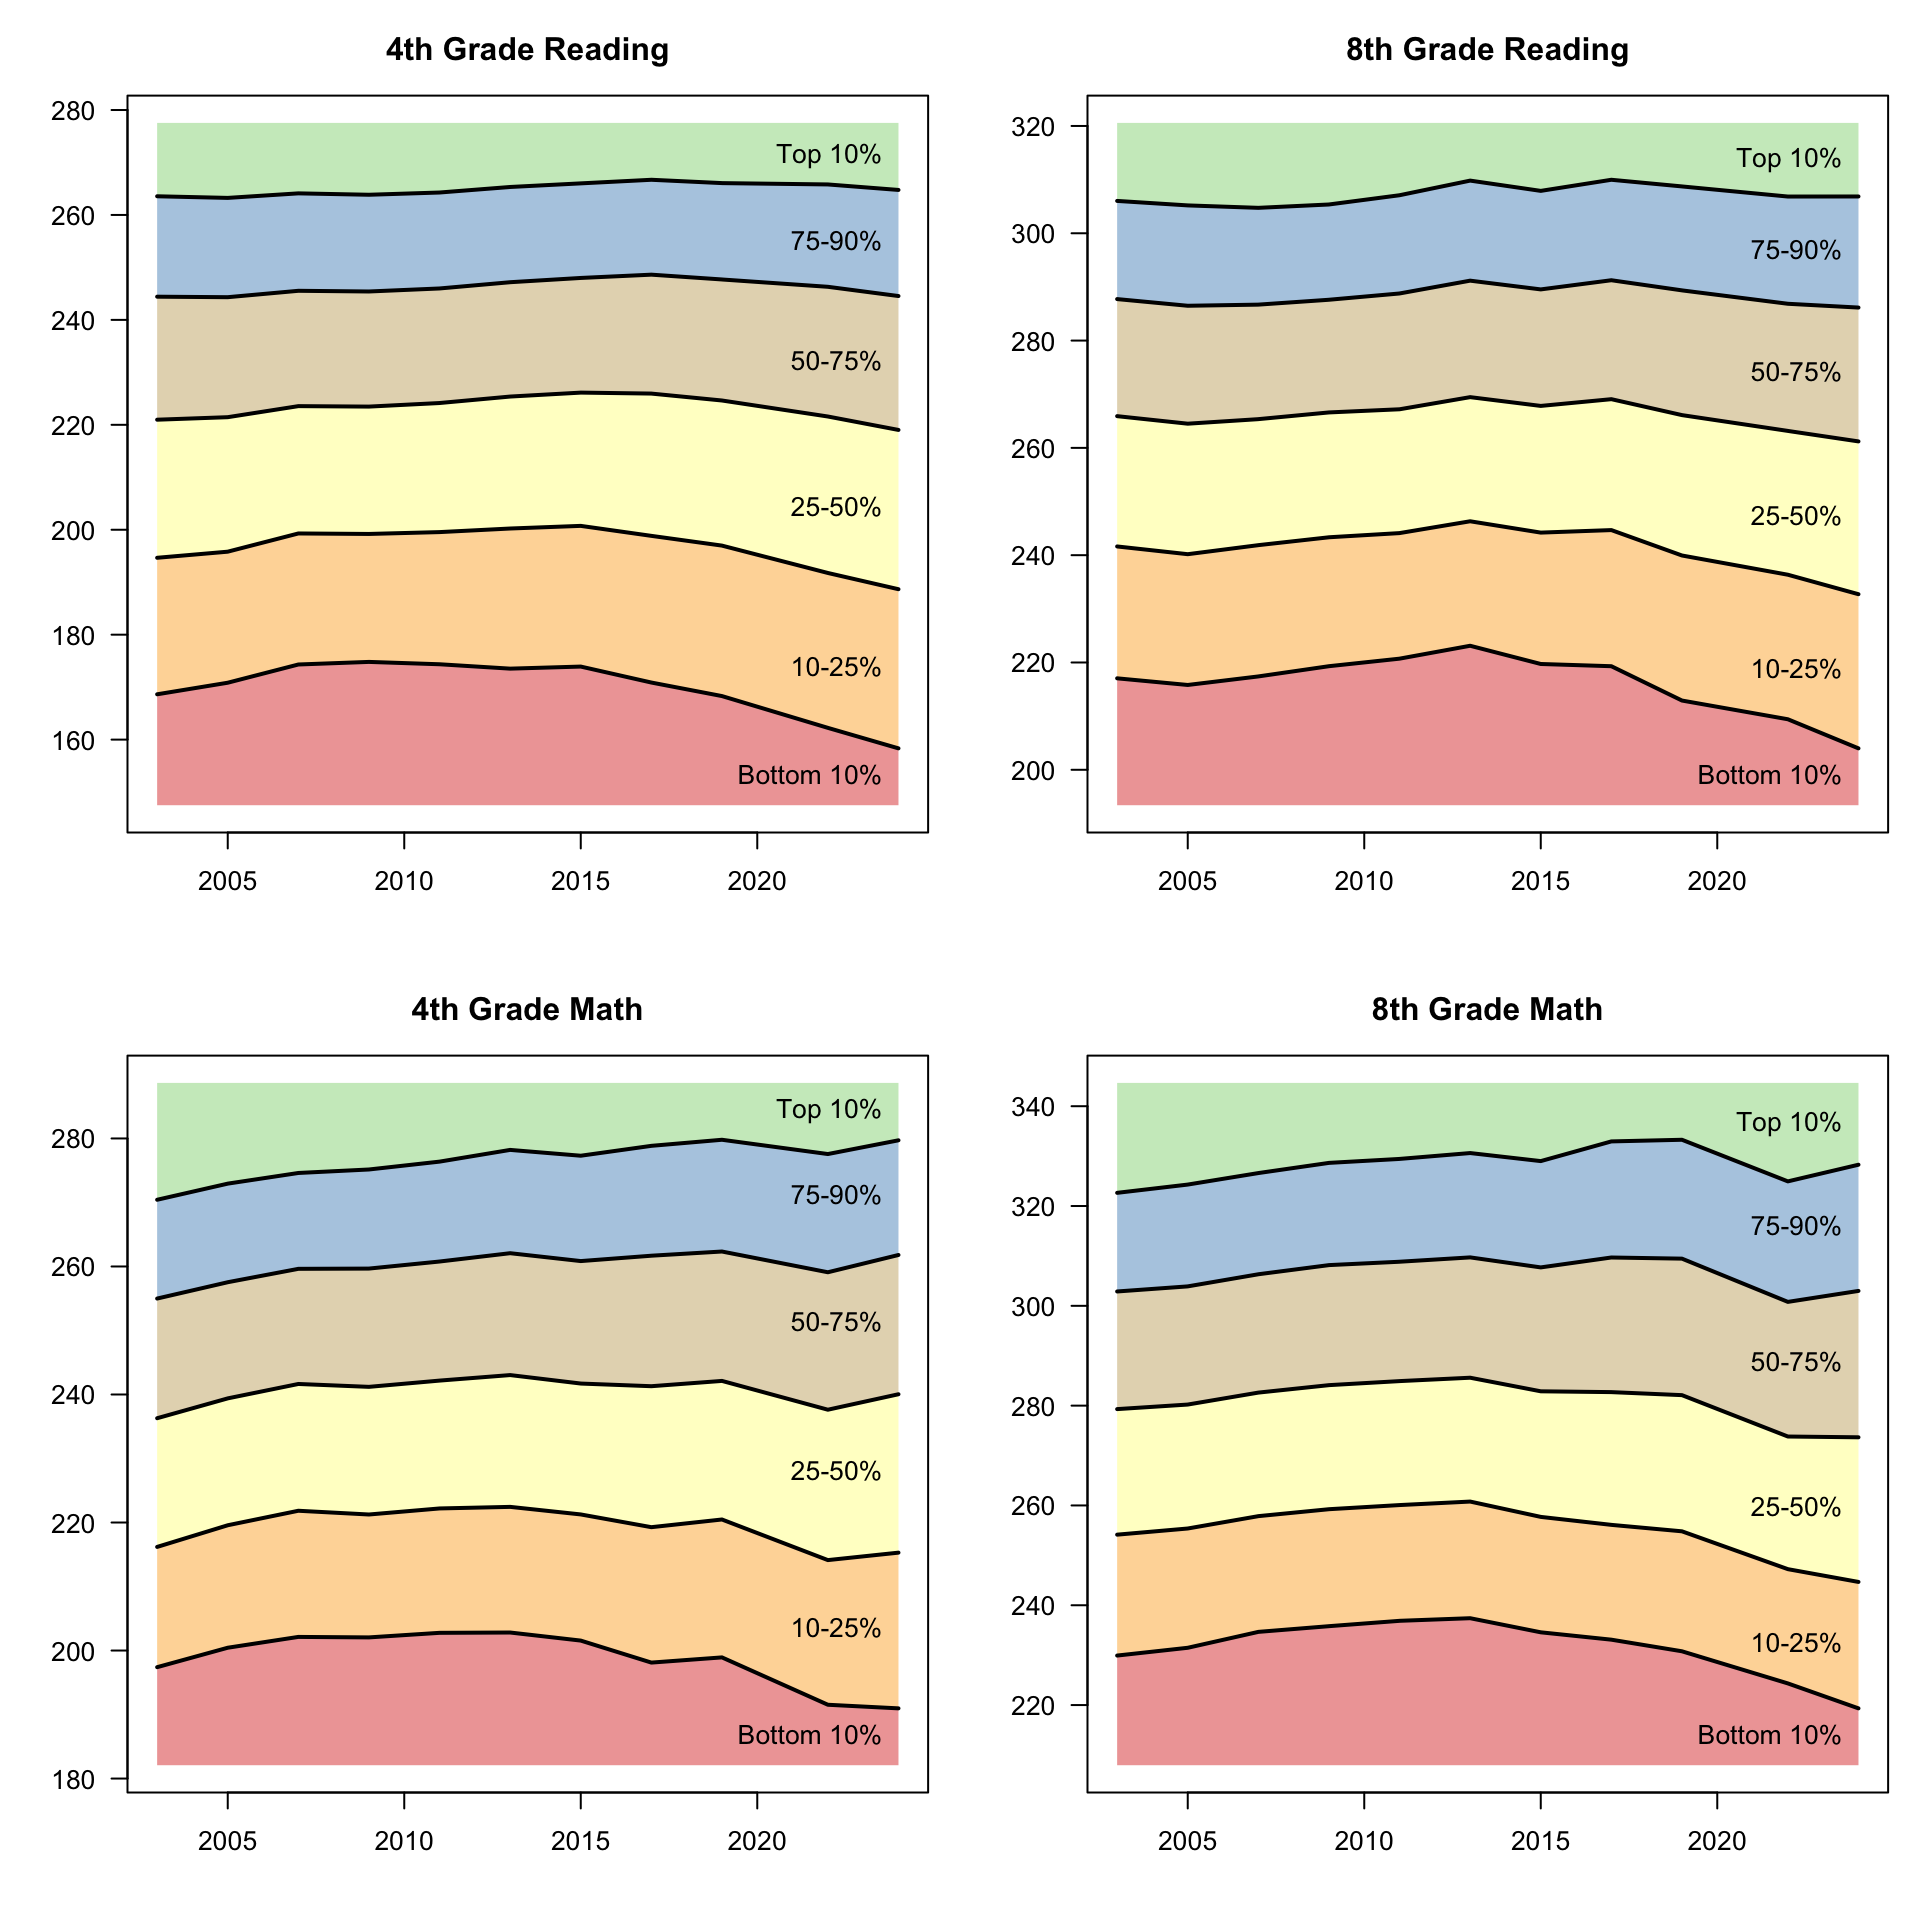
In these charts, lines going down means that scores are getting worse.The main thing I notice is that the 10th percentile line (separating red from orange) is falling significantly on all four charts. The decrease is much more modest for the median student (line separating yellow from beige). For high achieving (90th percentile) students, scores are actually flat for reading and rising for math. In other words, our best students are doing as well as (or slightly better than) before, but the bottom students are scoring worse than they have in decades.
When we look at achievement levels, we see a similar story. The percentage of students that score “Below Basic” is rising in all four charts (around 40% for 4th grade reading and 8th grade math). Meanwhile, the percentage of students who score “Advanced” is small but flat in reading, and is rising in math.
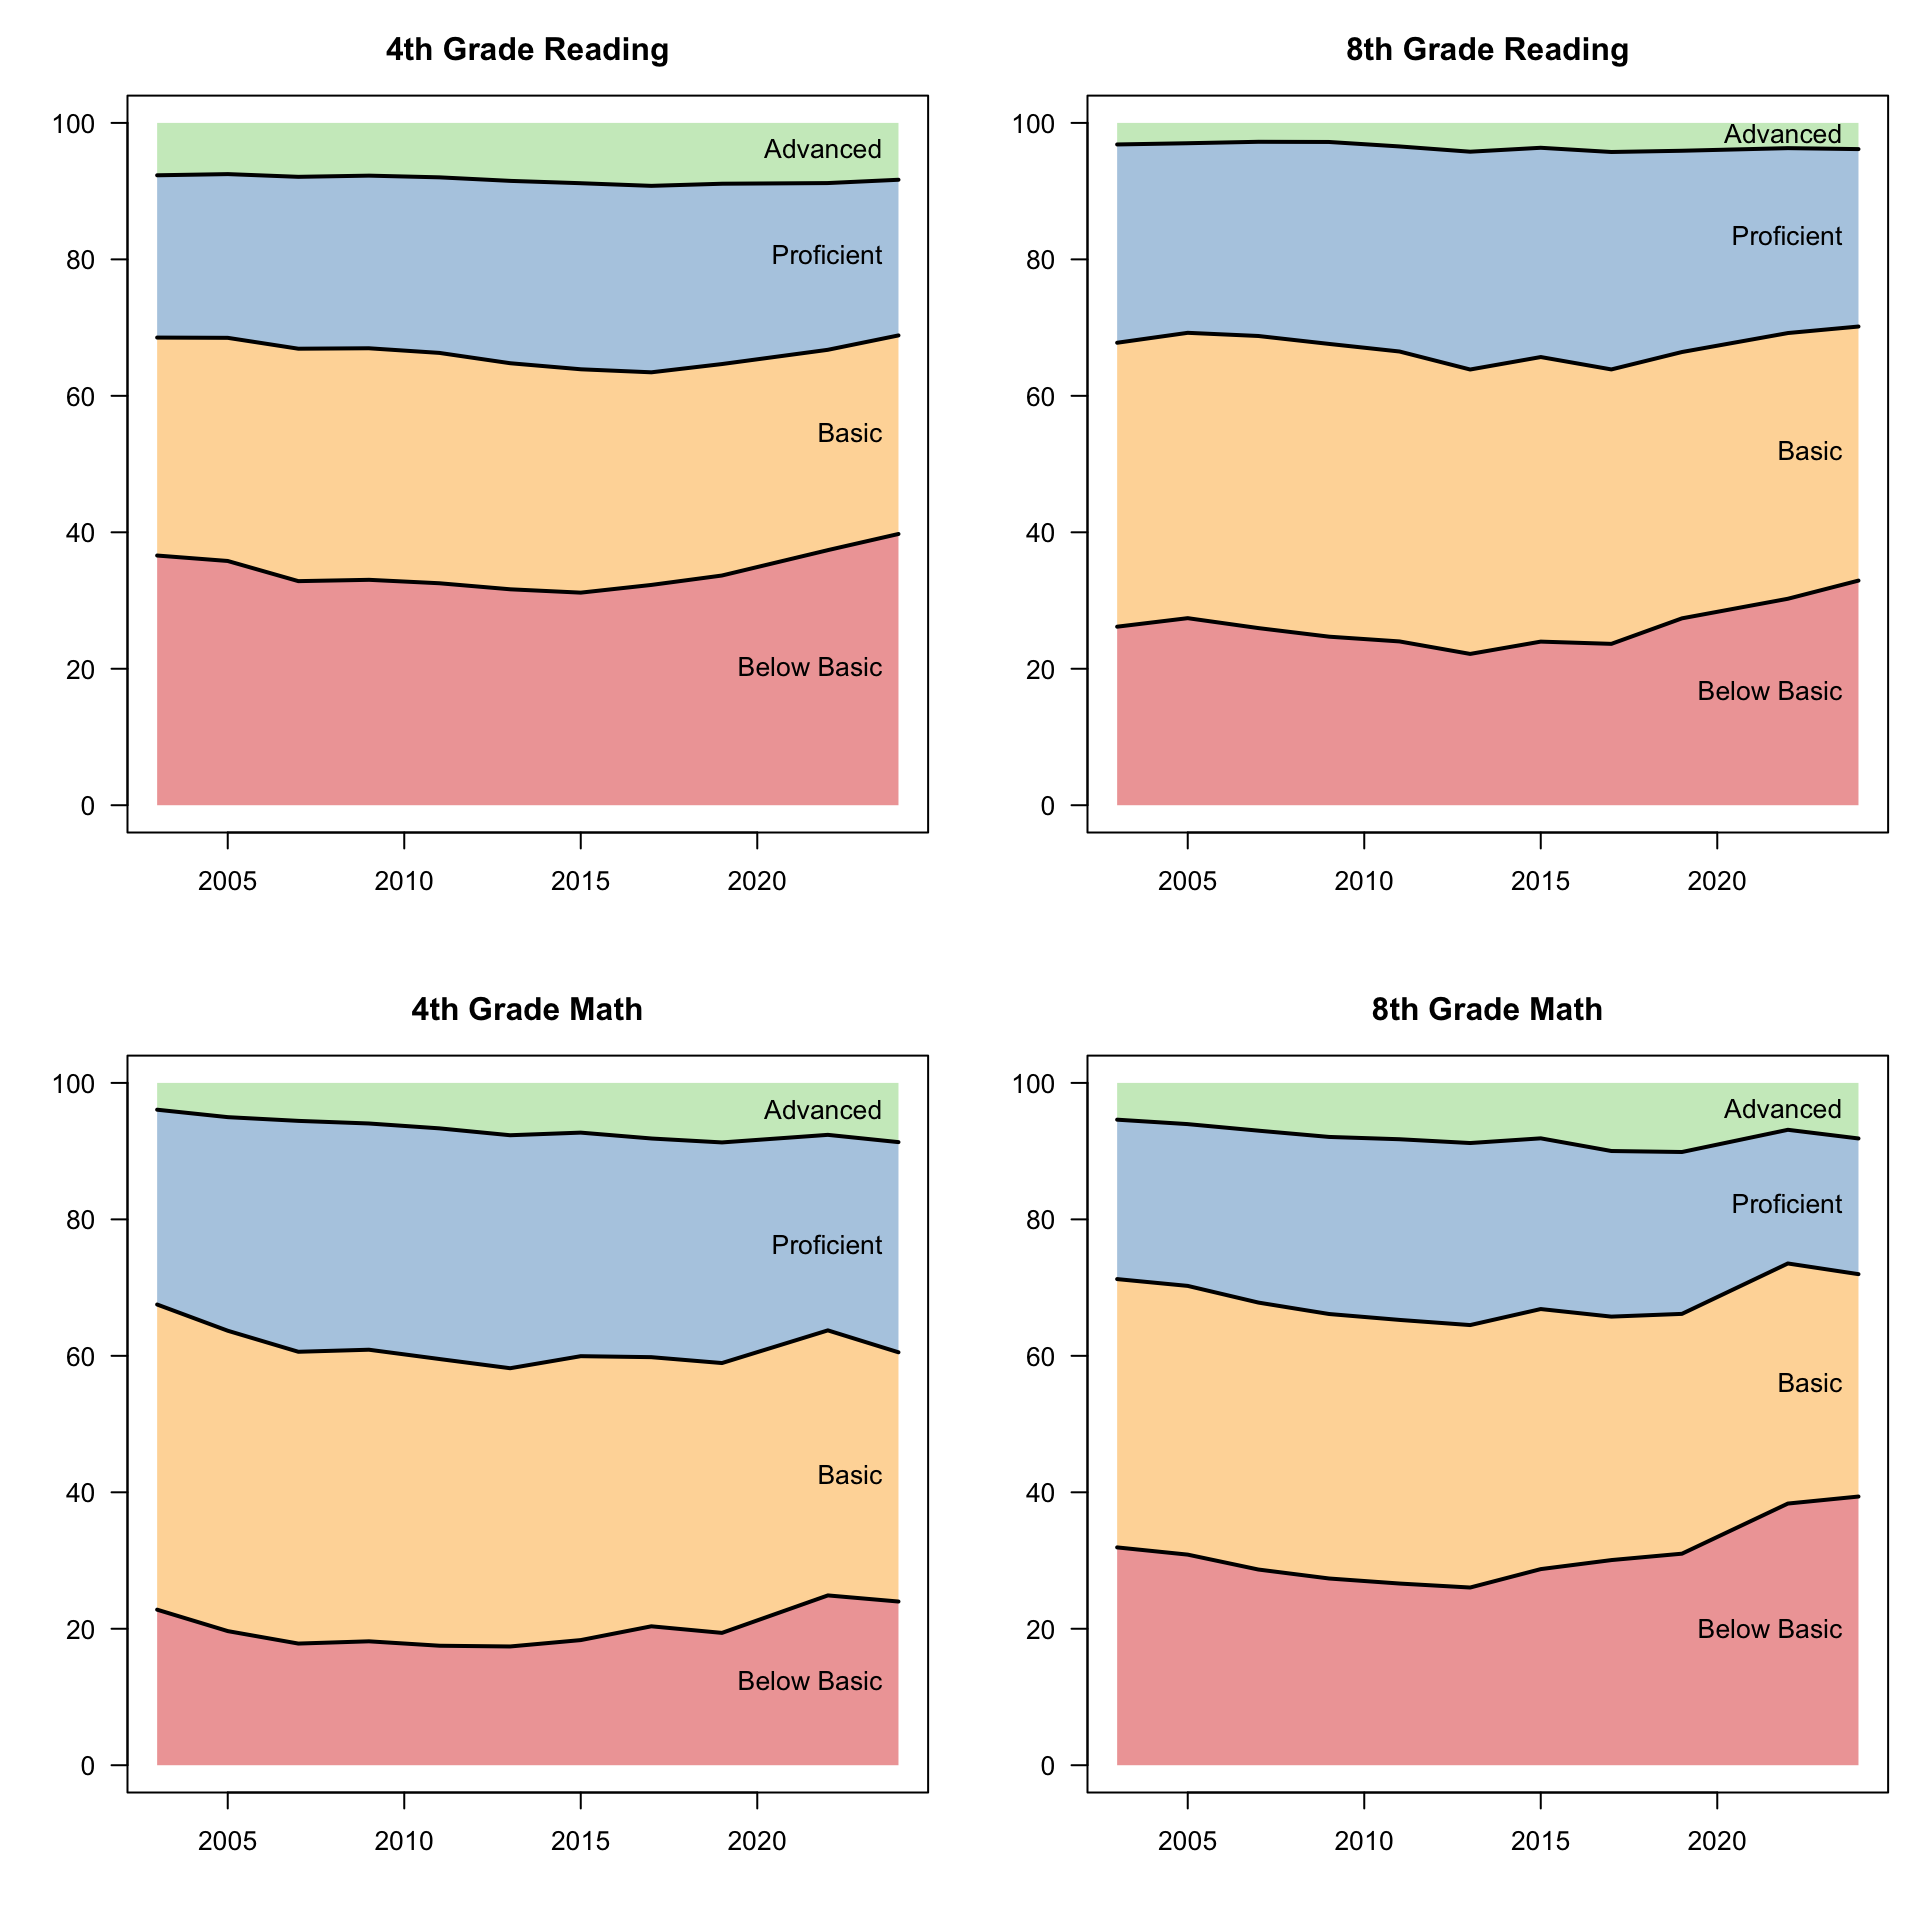
Note that the fall in the 10th percentile students is not visible in the achievement level charts, since those students were already “Below Basic”. In other words, more students are below basic than before, and (from the previous chart) many of the below basic students are even further behind than they used to be.
Variation Within and Across Grades
One interesting feature of NAEP scale scores is that they are put on a common scale from 0-500, and scored such that 8th graders (typically) receive a higher scores than 4th graders. I asked ChatGPT and Gemeni whether an 8th grader with a score of 240 and a 4th grader with a score of 240 are at similar absolute reading levels, and got two different answers (both with decent supporting evidence).
Gemeni says ‘yes’, and points to this page, which includes the following quote:
The results for all grades assessed are placed together on one reporting scale… Comparisons of overall national performance across grade levels on a cross-grade scale are acceptable.
Meanwhile, ChatGPT says ‘no’ and points to this page, which includes the following:
Although average scores are reported on a 0 to 500 scale at grades 4 and 8, the scale scores were derived separately and therefore scores cannot be compared across grades.
However, other aspects of ChatGPT’s answer were less convincing (it kept trying to explain that a 240 might count as proficient in grade 4 but not grade 8 – clearly true but beside the point), and when I shared a link to the first page, it walked back its claim. My sense after reading a bit more is that indeed, these numbers are meant to be comparable across grades, although of course the methodology for achieving this may not be perfect.
With this context, we can put the distribution for 4th and 8th grades side by side (box spans 25th-75th percentiles, with whiskers reaching down to 10th and up to 90th).
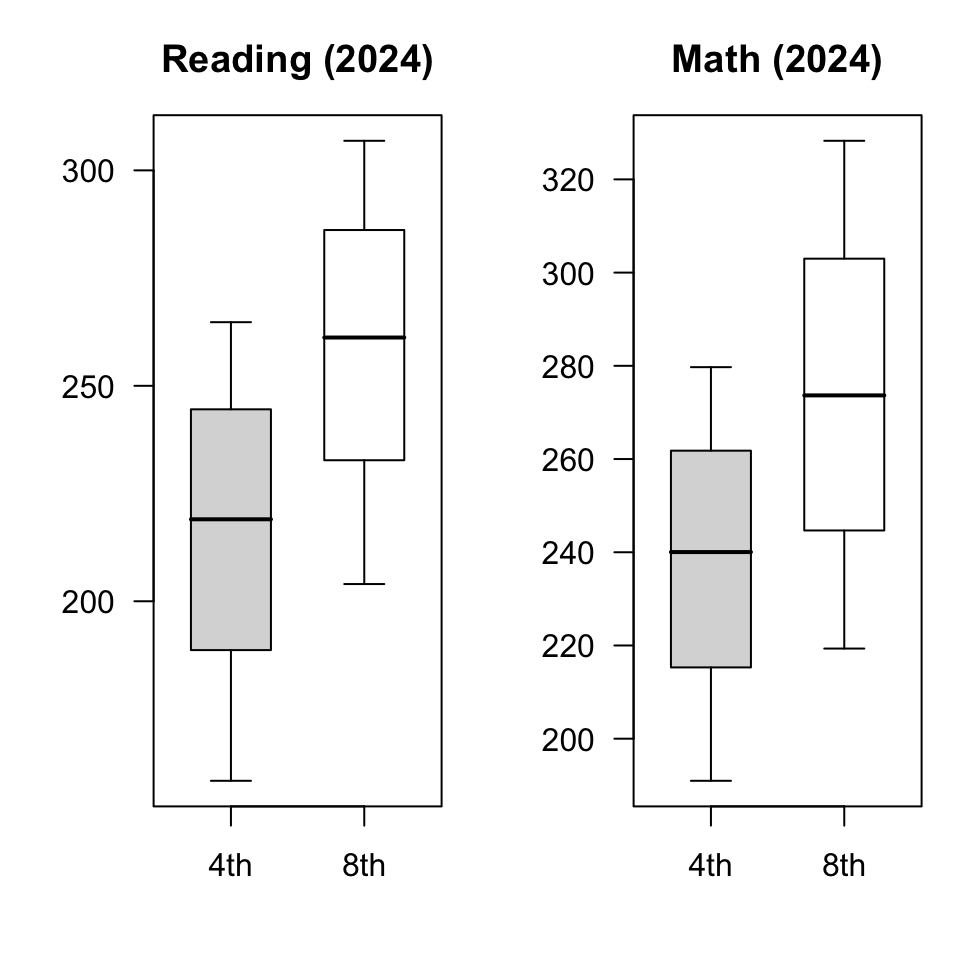
There are several interesting takeaways here. One is that there is quite a bit of overlap in the distributions. In both subjects, a 90th percentile 4th grader would be an above-median 8th grader. In math, a 25th percentile 8th grader is just a bit above the median 4th grader. In other words, essentially one fourth of eigth graders would not be out of place (academically) in a 4th grade math classroom! That’s pretty bad.
Put another way, students within a grade are separated by many years of learning. The gap between a 75th percentile 4th grader and a 25th percentile 4th grader is 56 scale points in reading and 46 scale points in math. The gap between the median 8th grader and the median 4th grader is smaller (42 and 34 points for reading and math, respectively). In other words, even if we cut out the bottom AND top quartiles of the 4th grade distribution, the difference in scores of the remaining (middle half of) students is larger than the gains we expect to see over 4 years of schooling!
This validates a common refrain from teachers about the difficulty of teaching classes where students are at very different levels. (Of course, the typical class will not be nationally representative and will likely not exhibit as big of a spread as the national data shows, but it seems quite plausible that students in the same class are often years apart in terms of content knowledge.)
To me, this is the big story: already by 4th grade, there are huge gaps in performance (equivalent to 5 years of learning). These gaps are just as large in 8th grade, and have actually been widening in recent years as the performance of low-performing students declines.
What Do We Do About It?
The title of this post is not a mistake, but rather a reference to a quote from George W. Bush when he was running for president in 2000: “Rarely is the question asked: is our children learning?” This went viral due to the incorrect grammatical construction, but the underlying point remains true today: discussions about education are often not informed by measurable learning outcomes.
The national data identifies a concerning fact: gaps between high and low achieving students are massive, and are growing as the performance of low-achievers falls. It does not really help us understand why this is occurring, or what we can do about it.
In future posts, I intend to conduct more analysis, using data from two sources. The first is state-level NAEP data, which allows us to identify states that are positive and negative outliers. Hopefully, we can learn from their experiences! The second data source is state-level tests (in Minnesota, the MCA). These are much more comprehensive, as most students take them every year in grades 3-8. Therefore, data is available at the school level, which is much more likely to offer actionable insights for teachers, principals, and school districts.
Code
For those interested in conducting their own analysis (or auditing mine), I am including the R code that I used to generate the figures above (written with significant assistance from ChatGPT). I am also linking to raw data files for 4th grade reading, 8th grade reading, 4th grade math and 8th grade math.
Loading the data:
clean_naep = function(naep){
  names(naep)[names(naep) == "at Advanced"] <- "Advanced"
  names(naep)[names(naep) == "below Basic"] <- "Below Basic"
  naep$Advanced = as.numeric(naep$Advanced)
  naep$"Below Basic" = as.numeric(naep$"Below Basic")
  naep$"Below Advanced" = 100 - naep$Advanced
  naep$"Below Proficient" = 100 - as.numeric(naep$"at or above Proficient")
  naep
}

library(readxl)
reading_4th = clean_naep(read_excel("../../static/Data/NAEP/NAEP_Reading_4th_National.xlsx"))
reading_8th = clean_naep(read_excel("../../static/Data/NAEP/NAEP_Reading_8th_National.xlsx"))
math_4th = clean_naep(read_excel("../../static/Data/NAEP/NAEP_Math_4th_National.xlsx"))
math_8th = clean_naep(read_excel("../../static/Data/NAEP/NAEP_Math_8th_National.xlsx"))
data_frames = list(reading_4th,reading_8th,math_4th,math_8th)
plot_names = c("4th Grade Reading","8th Grade Reading","4th Grade Math","8th Grade Math")
A helper function for plotting:
plot_percentile_curves <- function(
  df,
  jurisdiction = "National",
  pct_cols,
  start_year = -Inf,
  main = NULL,
  ymin = NA,
  ymax = NA,
  band_cols = NULL,
  band_labels = NULL
) {
  df <- as.data.frame(df, stringsAsFactors = FALSE)

  if (!("Year" %in% names(df))) stop("'Year' must already be filled.")
  if (!("Jurisdiction" %in% names(df))) stop("Couldn't find a 'Jurisdiction' column.")
  miss <- setdiff(pct_cols, names(df))
  if (length(miss)) stop("Couldn't find columns: ", paste(miss, collapse = ", "))

  df2 <- df[df$Jurisdiction == jurisdiction & df$Year >= start_year, c("Year", pct_cols)]
  df2 <- df2[order(df2$Year), ]
  if (!nrow(df2)) stop("No rows found for that state.")
  if (any(duplicated(df2$Year))) stop("Multiple rows per year for this state.")

  for (j in pct_cols) df2[[j]] <- as.numeric(df2[[j]])

  x <- df2$Year
  Y <- as.matrix(df2[pct_cols])

  if (is.na(ymin)) ymin <- 1.1*min(Y, na.rm = TRUE) - 0.1*max(Y, na.rm = TRUE)
  if (is.na(ymax)) ymax <- 1.1*max(Y, na.rm = TRUE) - 0.1*min(Y, na.rm = TRUE)
  if (is.null(main)) main <- paste(jurisdiction, "NAEP percentile curves")

  k <- ncol(Y)

  if (is.null(band_cols)) {
    band_cols <- gray(seq(.9, .6, length.out = k + 1))
  }
  if (is.null(band_labels)) {
    band_labels <- c(
      paste0("< ", pct_cols[1]),
      paste0(pct_cols[-k], "–", pct_cols[-1]),
      paste0("> ", pct_cols[k])
    )
  }

  shade_between <- function(lower, upper, col) {
    polygon(c(x, rev(x)), c(lower, rev(upper)), col = col, border = NA)
  }

  plot(x, Y[,1], type = "n", las = 1,
       xlab = "", ylab = "",
       ylim = c(ymin, ymax), main = main)

  shade_between(rep(ymin, length(x)), Y[,1], band_cols[1])
  for (i in 1:(k - 1)) shade_between(Y[,i], Y[,i+1], band_cols[i + 1])
  shade_between(Y[,k], rep(ymax, length(x)), band_cols[k + 1])

  matlines(x, Y, lty = 1, lwd = 2, col = "black")

  xr <- max(x)
  y_mid <- c(
    (ymin + Y[nrow(Y), 1]) / 2,
    (Y[nrow(Y), -k] + Y[nrow(Y), -1]) / 2,
    (Y[nrow(Y), k] + ymax) / 2
  )
  text(xr, y_mid, labels = band_labels, pos = 2, xpd = NA)

  invisible(df2)
}
Code for first set of figures (percentiles):
columns = c("10th percentile","25th percentile","50th percentile","75th percentile","90th percentile")
six_cols <- c(
  "#EFA6A6",  # pastel red
  "#FED9A6",  # pastel orange
  "#FFFFCC",  # pastel yellow
  "#E5D8BD",   # pastel tan
  "#B3CDE3",  # pastel blue
  "#CCEBC5"  # pastel green
)

par(mfrow = c(2, 2), mar = c(4, 4, 3, 1))
for(i in 1:4){
  plot_percentile_curves(
    data_frames[[i]],
    pct_cols = columns,
    start_year = 2003,
    band_labels = c("Bottom 10%","10-25%","25-50%","50-75%","75-90%","Top 10%"),
    band_cols = six_cols,
    main=plot_names[i]
  )
}
Code for second set of figures (achievement levels):
four_cols <- c(
  "#EFA6A6",  # pastel pink
  "#FED9A6",  # pastel orange
  "#B3CDE3",  # pastel blue
  "#CCEBC5"  # pastel green
)

levels = c("Below Basic","Below Proficient","Below Advanced")
par(mfrow = c(2, 2), mar = c(4, 4, 3, 1))
for(i in 1:4){
  plot_percentile_curves(
    data_frames[[i]],
    pct_cols = levels,
    start_year = 2003, ymin = 0, ymax = 100,
    band_labels = c("Below Basic","Basic","Proficient","Advanced"),
    band_cols = four_cols,
    main=plot_names[i]
  )
}
Code for third set of figures (box and whisker plots):
draw_box <- function(x, p, w = 0.3, col = "gray85") {
  rect(x - w, p[2], x + w, p[4], col = col, border = "black")
  segments(x - w, p[3], x + w, p[3], lwd = 2)
  segments(x, p[1], x, p[2])
  segments(x, p[4], x, p[5])
  segments(x - w/2, p[1], x + w/2, p[1])
  segments(x - w/2, p[5], x + w/2, p[5])
}

plot_box = function(df4,df8,yr,columns,title=""){
  p4 <- as.numeric(df4[df4$Year == yr & df4$Jurisdiction == "National", columns])
  p8 <- as.numeric(df8[df8$Year == yr & df8$Jurisdiction == "National", columns])
  ylim <- range(c(p4[c(1,5)], p8[c(1,5)]), na.rm = TRUE)
  plot(NA, xlim = c(0.5, 2.5), ylim = ylim, xaxt = "n",
     xlab = "", ylab="", main = title, las = 1)
  axis(1, at = c(1,2), labels = c("4th", "8th"))
  draw_box(1, p4)
  draw_box(2, p8, col = "white")
}

columns <- c("10th percentile", "25th percentile", "50th percentile", "75th percentile", "90th percentile")

par(mfrow = c(1, 2), mar = c(4, 4, 3, 1))
plot_box(reading_4th,reading_8th,yr=2024,title='Reading (2024)',columns)
plot_box(math_4th,math_8th,yr=2024,title='Math (2024)',columns)
The data is collected “survey style” rather than “census style”. In other words, only a small number of schools are asked to administer the exam to their students, and in those schools, only certain students are asked to take the exam. For each state, grade level, and subject, NAEP aims to sample from approximately 100 public schools and 2,500 total students. More details about their sampling procedures are available here. Charter schools are included in the sample of public schools. Some private schools are sampled, but not enough to get representative samples in each state. Therefore, data on private schools is only reported at the national level.↩︎
Here are links describing in more detail how Math Achievement and Reading Achievement are defined. Achievement Levels are also mapped to a corresponding minimum scale score (shown in parentheses on the linked pages). For example, NAEP Basic Reading for 4th graders corresponds to a scale score above 208. Note that ‘NAEP Proficient’ does not necessarily map to your state’s definition of proficiency: according to the report Mapping state standards to NAEP (2022), NAEP proficiency standards are more stringent than those set by most states. (Check out figures 1, 4, 7, and 10 in the report for estimates of where your state standards fall on the NAEP scale.)↩︎