In a previous post, I wrote about several strategies for reducing turnaround times for COVID tests. One interesting strategy that I did not write about is pooling, also known as pooled testing. What is pooling? I'll let the CDC Interim Guidance for Use of Pooling Procedures explain:
Pooling... means combining respiratory samples from several people and conducting one laboratory test on the combined pool of samples.
If a pooled test result is negative, then all specimens can be presumed negative with the single test. If the test result is positive or indeterminate, then all the specimens in the pool need to be retested individually.
The advantages of this two-stage specimen pooling strategy include preserving testing reagents and resources, reducing the amount of time required to test large numbers of specimens, and lowering the overall cost of testing.
The guidance goes on to explain that
A pooling strategy depends on the community prevalence of virus, and pool size will need to be adjusted accordingly. CDC recommends that laboratories should determine prevalence based on a rolling average of the positivity rate of their own SARS-CoV-2 testing over the previous 7–10 days.
The outline of this post is as follows:
Propose a simple model, and use it to estimate (i) the optimal pool size, and (ii) the magnitude of the reduction in testing.
Identify a puzzle: the CDC recommends abandoning pooling when the positivity rate hits double digits, whereas the model predicts that pooling could still offer significant benefits.
Discuss several ways to make the model more realistic, and note that all of them suggest that the simple model actually understates the benefits from pooling.
Study one downside of pooling: it creates additional work for lab technicians.
Choosing an Optimal Pool Size
Although there are many possible pooling strategies, I will focus on the approach recommended by the CDC: mix \(n\) samples together. If the mixture tests negative, report negative results for all samples. If it tests positive, test each sample individually.1
When setting the pool size \(n\), there is a tradeoff: combining many samples makes it possible to potentially "clear" many samples at once, but also increases the risk of a positive test (which then requires \(n\) new tests). For a given positivity rate, what is the optimal pool size? If we assume that each sample is positive independently with probability \(p\), then a pool of \(n\) samples tests negative with probability \((1 - p)^n\). If the pool tests positive, then each individual sample must be tested. Thus, expected number of tests per sample with positivity rate \(p\) and pool size \(n\) is \[\begin{equation} 1 - (1-p)^n + 1/n. \label{eq:tests-per-sample} \end{equation}\]We can use this to identify the optimal pool size, as a function of the positivity rate \(p\).
tests_per_sample = Vectorize(function(p,n){
    if(n==1){return(1)}
    return(1 - (1 - p)^n+1/n)
})

optimal_n = Vectorize(function(p){
    tps = tests_per_sample(p,c(1:100))
    return(which(tps==min(tps)))
})

par(mar=c(4,5,1,1), cex.axis = 1.5,cex.lab=2)
plot(optimal_n,xlim=c(0.01,.4),xlab='Positivity Rate',ylim=c(1,11),ylab='Optimal Pool Size',las=1)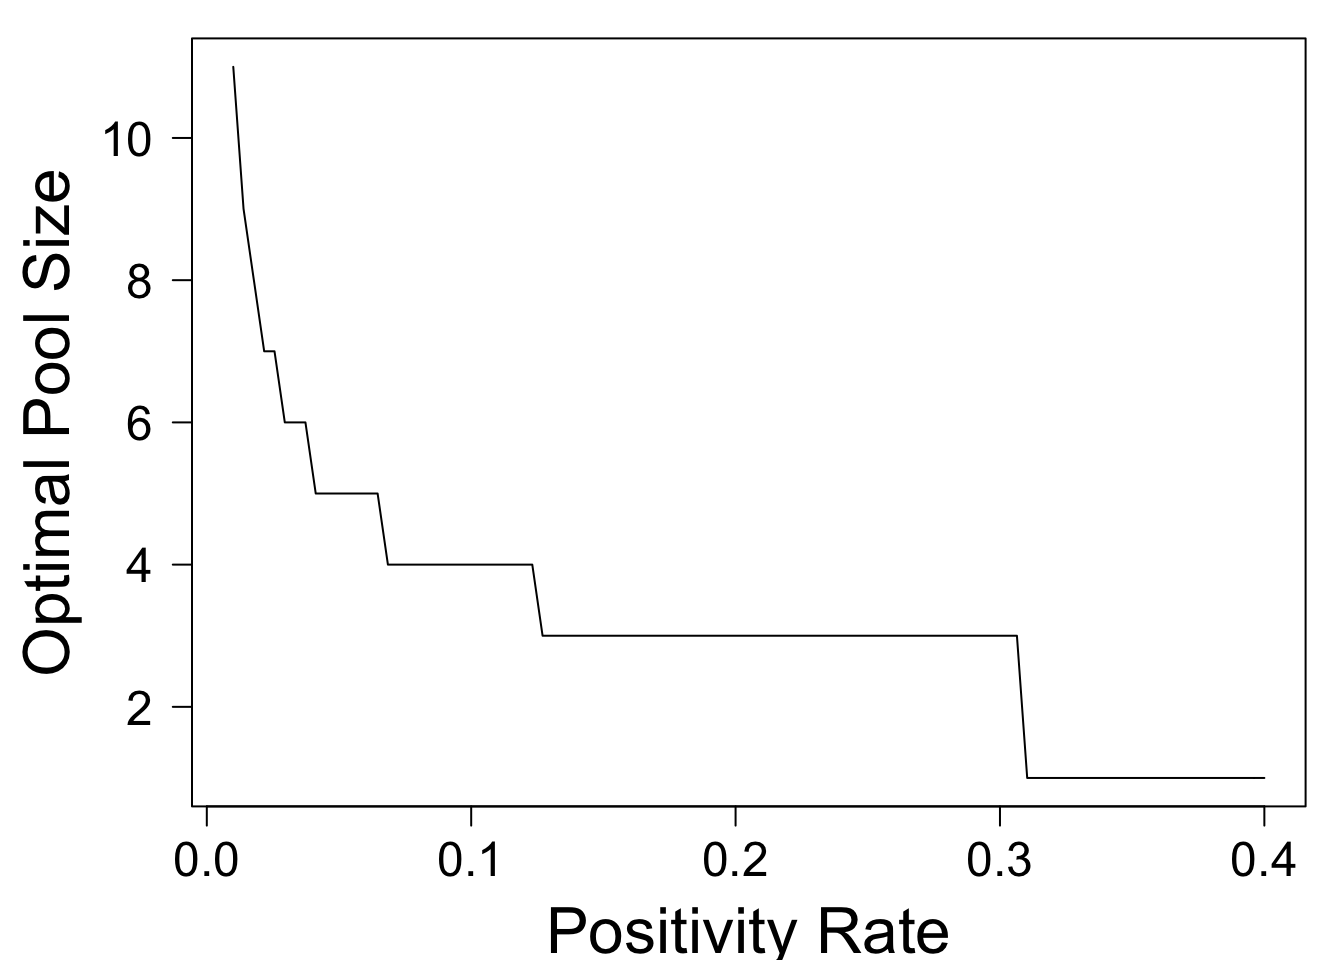
This shows that the optimal pool size decreases as \(p\) rises. At a positivity rate of \(p = .02\), the optimal pool size is \(8\) people. At \(p = .13\), it drops to three people, and for \(p > .31\), it is optimal to abandon pooling altogether. In general, the optimal pool size is approximately the ceiling of \(1/\sqrt{p}\).
How Many Fewer Tests are Needed?
The preceding section provided guidance on choosing the pool size, as a function of the positivity rate \(p\). Now we ask, if we choose the pool size optimally, how many fewer tests are needed? Clearly, the answer depends on the positivity rate. The following code plots the expected number of tests per sample, as a function of \(p\).
optimal_tps = Vectorize(function(p){
    tps = tests_per_sample(p,c(1:100))
    return(min(tps))
})

par(mar=c(4,5,1,1), cex.axis = 1.5,cex.lab=2)
plot(optimal_tps,xlim=c(0,.4),xlab='Positivity Rate',ylab='Expected Tests Per Sample',las=1)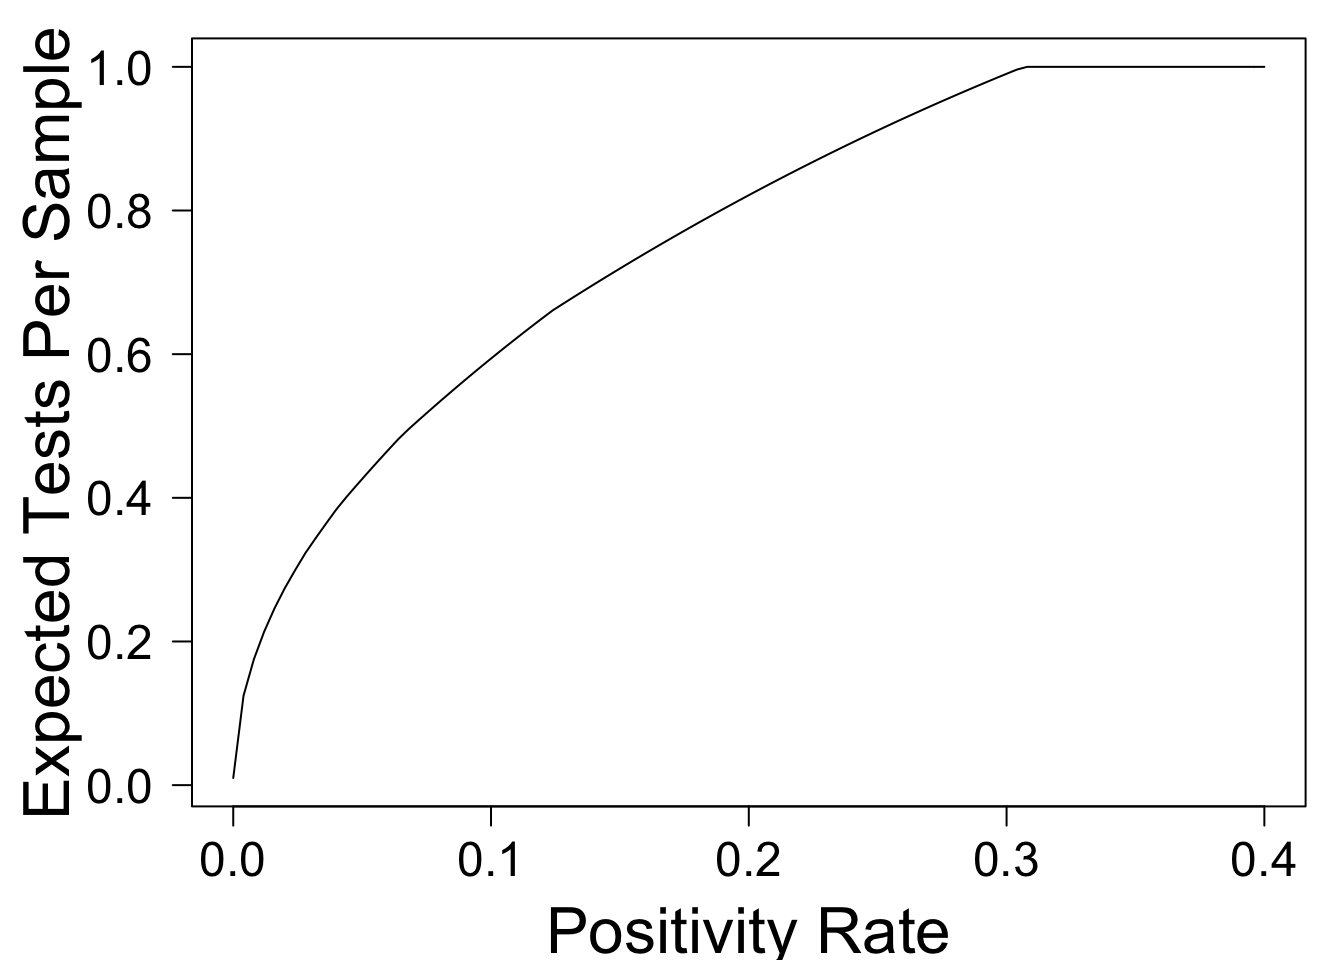
This shows that when \(p = .01\), pooling can reduce the overall number of tests by approximately \(80\%\)! As \(p\) rises, the benefit from pooling falls -- a fact which is widely recognized. For example, the NYTimes Article Why Pooled Testing for the Coronavirus Isn’t Working in America has the following subheadline:
Combining samples for coronavirus testing, an approach once hailed by U.S. health officials, only works when the vast majority of tests are negative.
Although the phrase "vast majority" is imprecise, the article goes on to make specific claims. For example, it writes
Nebraska’s state public health laboratory, for example, was a pooling trailblazer when it began combining five samples a test in mid-March, cutting the number of necessary tests by about half.
According to our simple model, pools of size \(n = 5\) should cut testing in half when the positivity rate \(p = 0.07\) (and indeed \(n = 5\) is approximately optimal in this case). So far so good. But then, the article writes,
The lab was forced to halt its streak on April 27, when local positivity rates — the proportion of tests that turn up positive — surged past 10 percent. With that many positives, there was little benefit in pooling.
[The CDC] stipulates that pooling shouldn’t be used when positivity rates exceed 10 percent. But at Mayo Clinic, “we’d have to start to question it once prevalence goes above 2 percent, definitely above 5 percent,” Dr. Pritt said.
This guideline is mysterious to me. The simple model above predicts that pooling can reduce the number of tests by \(40\%\) when \(p = .1\), and by \(28\%\) when \(p = 0.15\). These still seem like significant gains!
Do We Need a More Detailed Model?
The preceding section identified an apparent discrepancy between the CDC guideline that pooling be abandoned at a positivity rate of 10%, and the model prediction that at this positivity rate, pooling can reduce tests by 40%. Is the model missing something?
Well, yes. It's missing many things. One obvious place to start is the assumption that samples are iid. In practice, we may have additional information about each sample. For example, some samples may be from people experiencing symptoms, while others may be from people who are periodically tested by their workplace. If labs were given this information, they could combine the latter samples (which are presumably lower risk) into large pools, while using smaller pools (or possibly no pools at all) for higher-risk samples. This suggests that the simple model above might actually underestimate the potential benefit of pooling at a given positivity rate. Indeed, the Times article writes
in states, cities or even neighborhoods where coronavirus prevalence rates are high, less-hard-hit populations — “cold spots” — can still be plucked out and pooled.
Another factor to consider is that certain test outcomes may be correlated. For example, if a romantic couple gets tested, it is likely that their samples are either both positive, or both negative. Fixing the overall number of positive samples, pooling is most effective when there are many positives in one pool, and none in others. Therefore, if samples in a pool are positively correlated (as might be expected from a couple or a workplace), then a model that assumes independence again underestimates the benefit of pooling.2 In other words, correlation could not explain the pessimistic conclusion that pooling is useless when the positivity rate is 10%.
There are many other potential considerations. For example, pooling might reduce sensitivity of the test, resulting in more false negatives. I don't know how to model that quantitatively, but thankfully I don't have to: some researchers from Duke have already done it, and written about their model in the Journal of the American Medical Association (JAMA). They offer a publicly available online tool, which allows you to put in all sorts of science-y parameters, and generates predictions about many measures of interest, including number of tests performed. I clicked "symptomatic patients" and left all other parameters at their default values. I then compared their predictions for the number of tests, against those of the extremely simple model. I then repeated the experiment, adjusting the positivity rate up from \(0.01\) to \(0.1\). This resulted in the following graphs:
 to those of my simple model, for positivity rate $p = 0.01$ (left) and $p = 0.1$ (right).](/Comparison1.jpg)
 to those of my simple model, for positivity rate $p = 0.01$ (left) and $p = 0.1$ (right).](/Comparison10.jpg)
Figure 1: Comparing the predictions of this online tool to those of my simple model, for positivity rate \(p = 0.01\) (left) and \(p = 0.1\) (right).
Two things to note. First, there is a remarkable level of agreement to the two models, considering all of the complexities that my model admits. Second, the more complex model actually predicts even fewer tests than the simple one does. When I repeated this exercise for asymptomatic patients, the curves don't match quite as closely, but again their model predicts fewer tests than mine. Overall, this seems to indicate that the numbers predicted by my simple model are reasonable (if imperfect).
A Possible Downside
So, if pooling can reduce the number of tests even at positivity rates of 10-15%, why won't labs do it? The Times article points out that pooling creates additional operational challenges:
Pooling can also be onerous for lab technicians. Though simple in theory, batching samples is tedious and time-consuming.
“Pooling could help us do more tests with fewer reagents... But if one of your issues is staffing, this doesn’t really help us at all.”
If we do not use pooling, lab technicians only have to transfer material once per sample. Under our simple two-stage pooling strategy, they may have to do this twice. If we set \(n\) to minimize the number of tests per sample, how much extra work have we created for our technicians? This, too, can be answered with our model.
extractions_per_sample = Vectorize(function(p,n){
    if(n==1){return(1)}
    return(2 - (1 - p)^n)
})

par(mar=c(4,5,1,1), cex.axis = 1.5,cex.lab=2)
plot(function(p){return(extractions_per_sample(p,optimal_n(p)))},xlim=c(0,.4),xlab='Positivity Rate',ylab='Extractions Per Sample',las=1)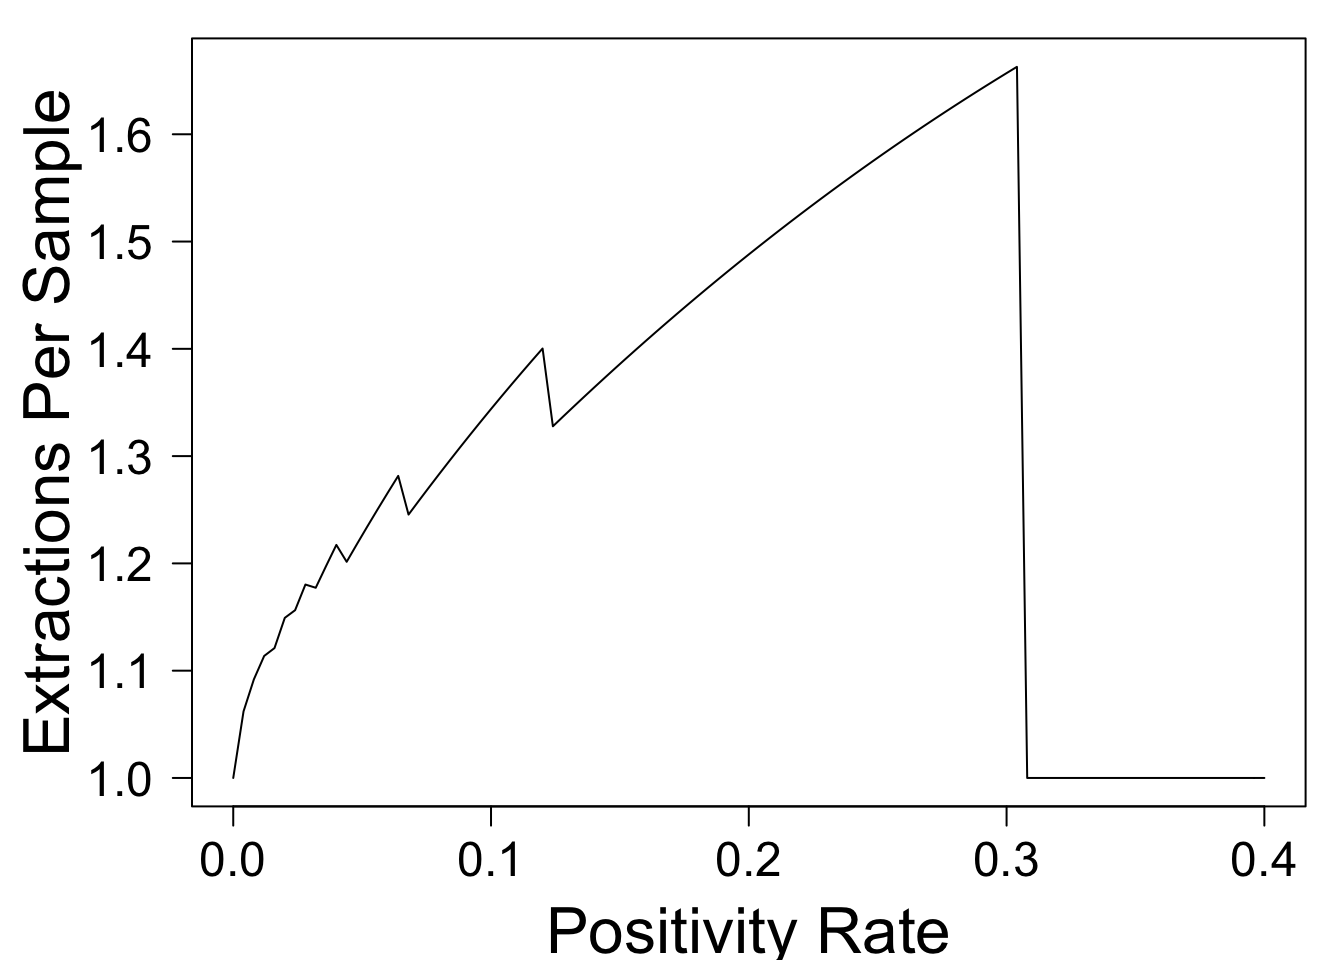
This shows that when the test positivity rate is small, pooling doesn't increase technicians' workload by much, because most pools come back negative. However, when \(p = 0.1\), the \(40\%\) reduction in PCR testing comes at the cost of a \(34\%\) increase in workload for technicians. This could make it unpopular with the already overworked staff, and could potentially create a new bottleneck.
Summary
This post has used an extremely simple model to explore the potential benefits of pooling COVID tests. The model suggests that pool sizes should shrink as the positivity rate \(p\) rises (with the optimal pool size approximately \(1/\sqrt{p}\)). Although the benefits are most significant when \(p\) is small, even when \(p = 0.1\) or higher, pooling can significantly reduce the total number of tests. This finding is robust to the introduction of sample-specific information and positive correlation across samples. Furthermore, it agrees with the predictions of a far more detailed model published in JAMA.
This leaves open the question of why the CDC recommends that labs stop using pooled testing when the positivity rate hits 10%. This post discusses one potential downside: additional work for lab techs. Another downside is reduced sensitivity of the test, leading to more false negatives.
What are the important factors that this model is missing? Are the CDC and testing labs simply being too conservative with their pooling strategy? I'd love to hear your thoughts (about these or other questions) below.
I recently discovered that this strategy was proposed by Robert Dorfman in 1943 (obviously, he was thinking about contexts other than COVID testing). This Nature article proposes a more sophisticated pooling strategy, but I'll save a discussion of such strategies for a future post.↩
One way to build intuition is to work through a simple example in which four couples get tested. To simplify, suppose that for each couple, either both members have COVID, or neither does, with the probability of having COVID equal to 10%. We intend to test these eight samples in two pools of four. If each pool includes one member of each couple, then samples within a pool are independent: each pool has approximately \(1 - (1-.1)^4 \approx 34\%\) chance of being positive, and the expected number of tests needed for all 8 people is approximately 4.75. On the other hand, if we put two couples into the first pool and the other two couples into the second, then each pool has only a \(1 - (1 - .1)^2 = 19\%\) chance of being positive, reducing the number of tests required to approximately \(3.5\). A similar idea applies even if couples' outcomes are not perfectly correlated.↩