Saint Paul just approved an increase in property taxes to provide an additional $37 million per year for public schools. This is approximately $1,100 for each student in the district. This made me wonder, what is the current budget? How does this compare to historical budgets, and to budgets of other nearby districts? And how is this money being spent?
I knew almost nothing about the Saint Paul Public School (SPPS) budget, but fortunately, a lot of information is publicly available if you are willing to do some digging! This post shares some facts that I have recently learned. I’m going to do this in quiz form – give the following questions your best guess. (Data and information on data sources is at the end of the post.)
Quiz
- How much is SPPS spending per student (total expenditures/total enrollment)?
- Less than $10,000
- $10,000-$15,000
- $15,000-$20,000
- $20,000-$25,000
- More than $25,000
- Compared to 20 years ago (2004-2005), are (inflation-adjusted) per-student expenditures higher or lower today? By what percentage?
- Lower, by approximately 20%
- Lower, by approximately 10%
- Higher, by approximately 10%
- Higher, by approximately 20%
- Higher, by more than 20%
- Among the following 15 Public School Districts, where does Saint Paul rank in terms of per-student expenditures? (Note: all of these districts are in the Twin Cities Metropolitan Area; most are suburban.)
- Anoka-Hennepin
- Burnsville-Eagan-Savage
- Edina
- Minneapolis
- Minnetonka
- Mounds View
- North Saint Paul-Maplewood-Oakdale
- Osseo
- Roseville
- Rosemount-Apple Valley-Eagan
- Saint Paul
- Shakopee
- South Washington County
- Wayzata
- White Bear Lake
- Saint Paul Public Schools spends money from five funds. Two of these are “Building Construction” and “Debt Services” (which pays off debts from past construction projects). Last year, how much did Saint Paul spend per student from these two funds combined?
- Under $1,000
- $1,000 - $2,000
- $2,000 - $3,000
- $3,000 - $4,000
- Over $4,000
- The majority of the SPPS budget comes from the General Fund, which accounts for just over $23,000 per student. This money falls into eleven categories of expense, six of which are listed below. Rank these categories (placed in a random order) in terms of total expenditure. For bonus points, approximately how much money goes to each of these categories?
- Special Education
- Student Transportation
- Pupil Support Services
- Instructional Support Services
- Regular Instruction
- Student Activities and Athletics
- General Fund expenditures are also categorized as either “Site Based” (costs expenses at individual schools) or “District Based” (costs not easily traced to individual schools). How many of the $23,000 are District Based spending?
- Under $2,000
- $2,000 - $5,000
- $5,000 - $8,000
- $8,000 - $11,000
- Over $11,000
Answers
\(e)\) SPPS spends approximately $32,000 per student.
\(e)\) $32,000 is about 42% higher than it was in the 2004-2005 school year (when expenditures were $14,000 per student, equivalent to a little over $23,000 in 2025 dollars).
Saint Paul ranks first among these 15 districts in per-student expenditures, narrowly beating out Minneapolis. On average, the other 14 districts spend $24,000 per student; approximately 3/4 of Saint Paul’s costs.
\(e)\) Construction and debt servicing cost Saint Paul approximately $7,000 per student last year.
The breakdown is as follows (totals do not add to $23,000 because some categories were omitted from the question).
- Regular Instruction ($9,000/student, 39.1% of General Fund)
- Special Education ($4,400/student, 19.1% of General Fund)
- Student Transportation ($1,300/student, 5.7% of General Fund)
- Pupil Support Services ($1,200/student, 5.2% of General Fund)
- Instructional Support Services ($1,100/student, 4.9% of General Fund)
- Student Activities and Athletics ($300/student, 1.3% of General Fund)
A natural follow-up question is, what are “Pupil Support Services” and “Instructional Support Services”? I’ll discuss instructional support services a bit below. Pupil support services will have to wait for another post.
- \(d)\) Approximately $9,400/student of the general fund budget goes to district-based expenses.
High-Level Conclusions
The conclusions I draw from this quiz are as follows:
- There is already enough money available to educate our students.
- SPPS is spending a lot on buildings, which I don’t see as central to providing a good education.
- A lot of money is going to special education and to district-level expenses. We should make sure that these investments are actually helping our students.
Below, I elaborate on each point.
There is plenty of money available
To put the spending in context, SPPS per-student expenditures are
- Higher than daycare costs.
- Approximately equal to in-state tuition, room and board at the University of Minnesota.
- Significantly higher than they have been historically.
- Significantly higher than they are in nearby districts.
I include the first two reference points because people often speak about the high cost of daycare and of higher education. I agree that these are costly! But in fact, they are no more costly than the rest of our education system.1
The reality is, all levels of education are expensive, but we pay for them in very different ways. K-12 education costs are shared by all of society, and spread out over time (I pay into the system for my entire adult life, even though each of my children will attend for 12-13 years). Meanwhile, daycare and college expenses are paid by individual families in the year that they occur.
I include the third and fourth comparisons (to other years and districts) because people often have the impression that funding for public education has declined, or is higher elsewhere. The referendum handout created by SPPS includes figures designed to create this impression.
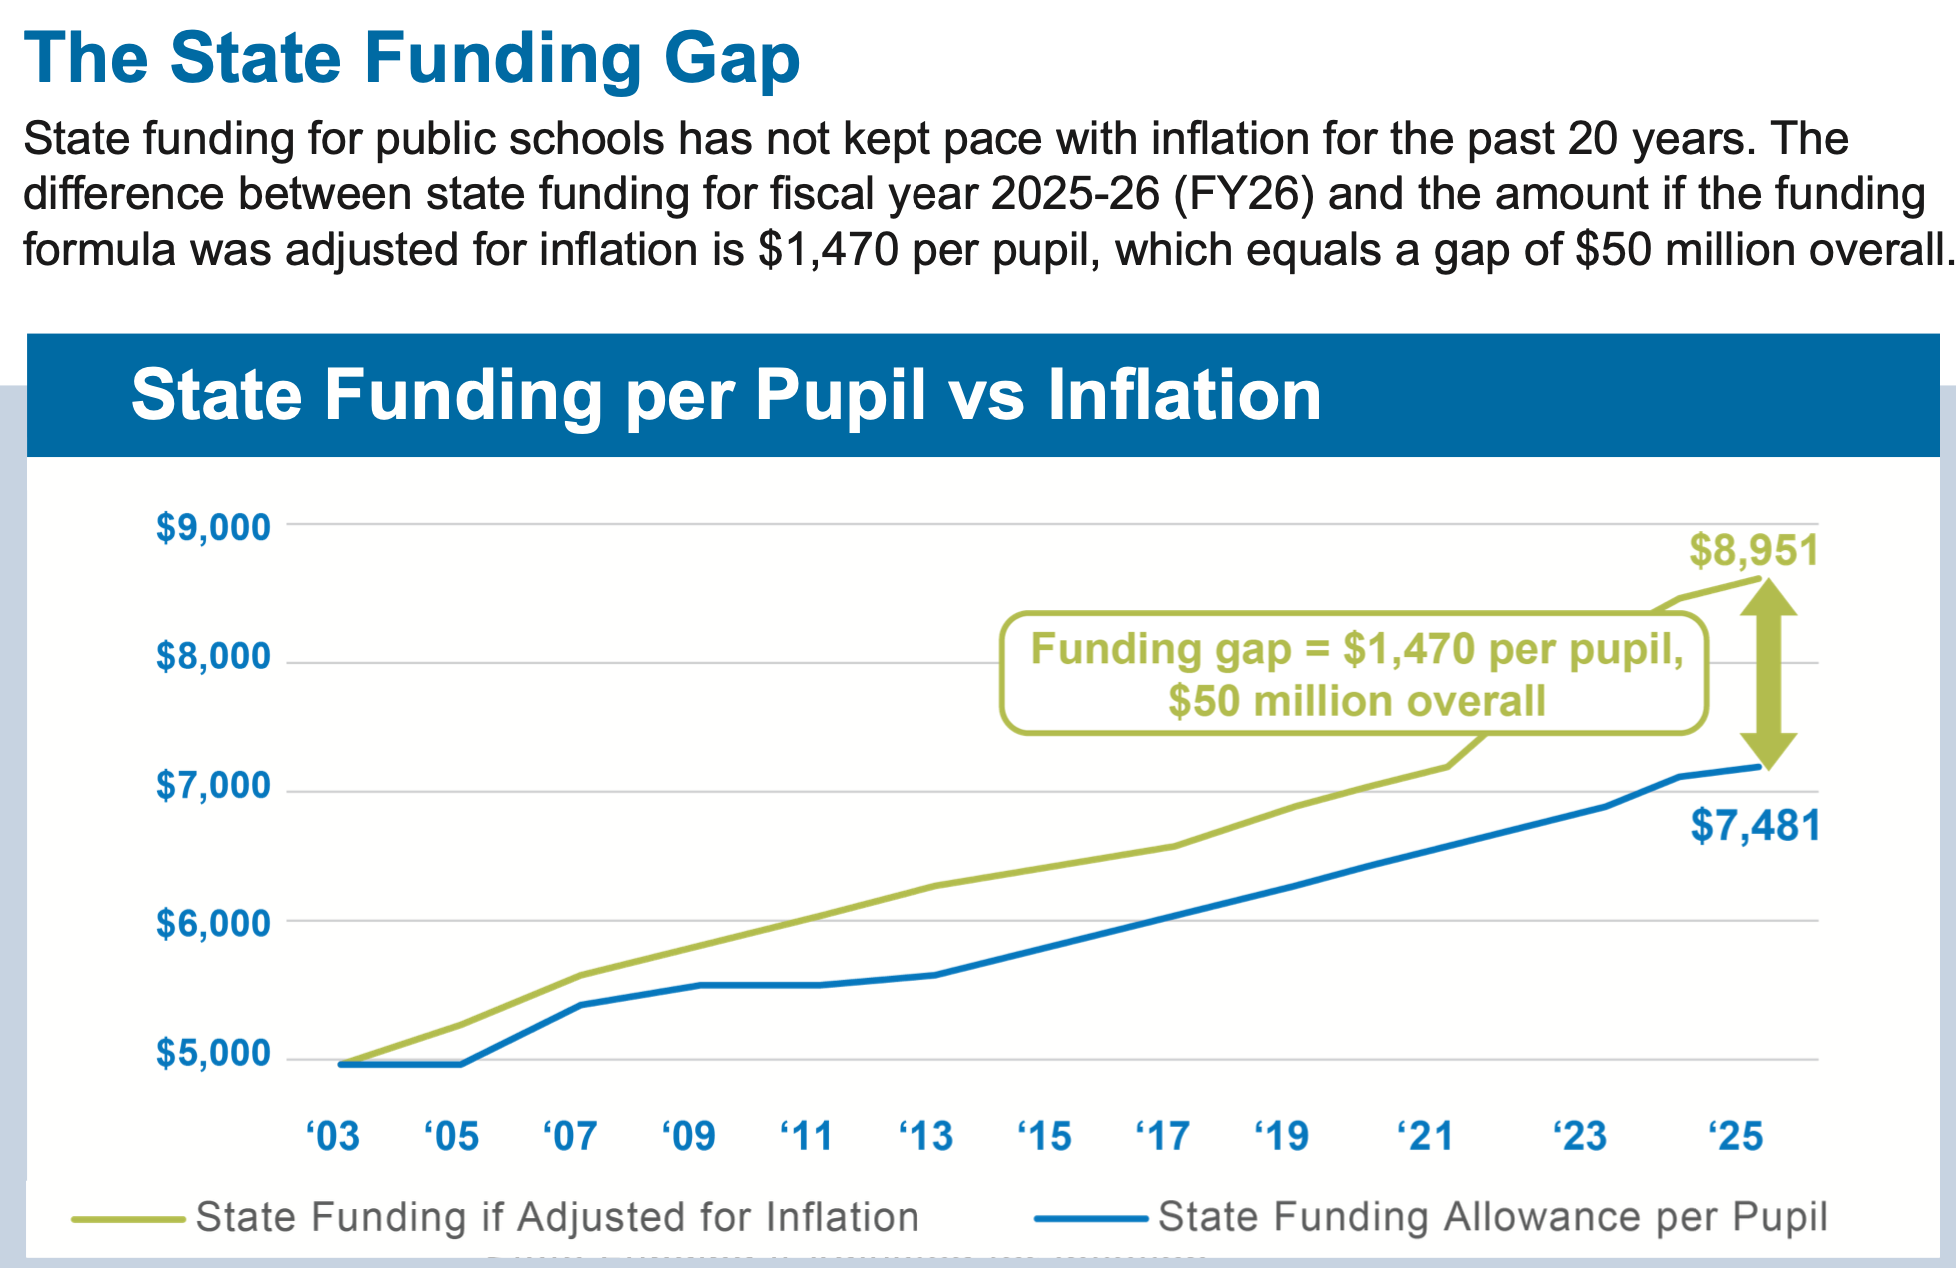
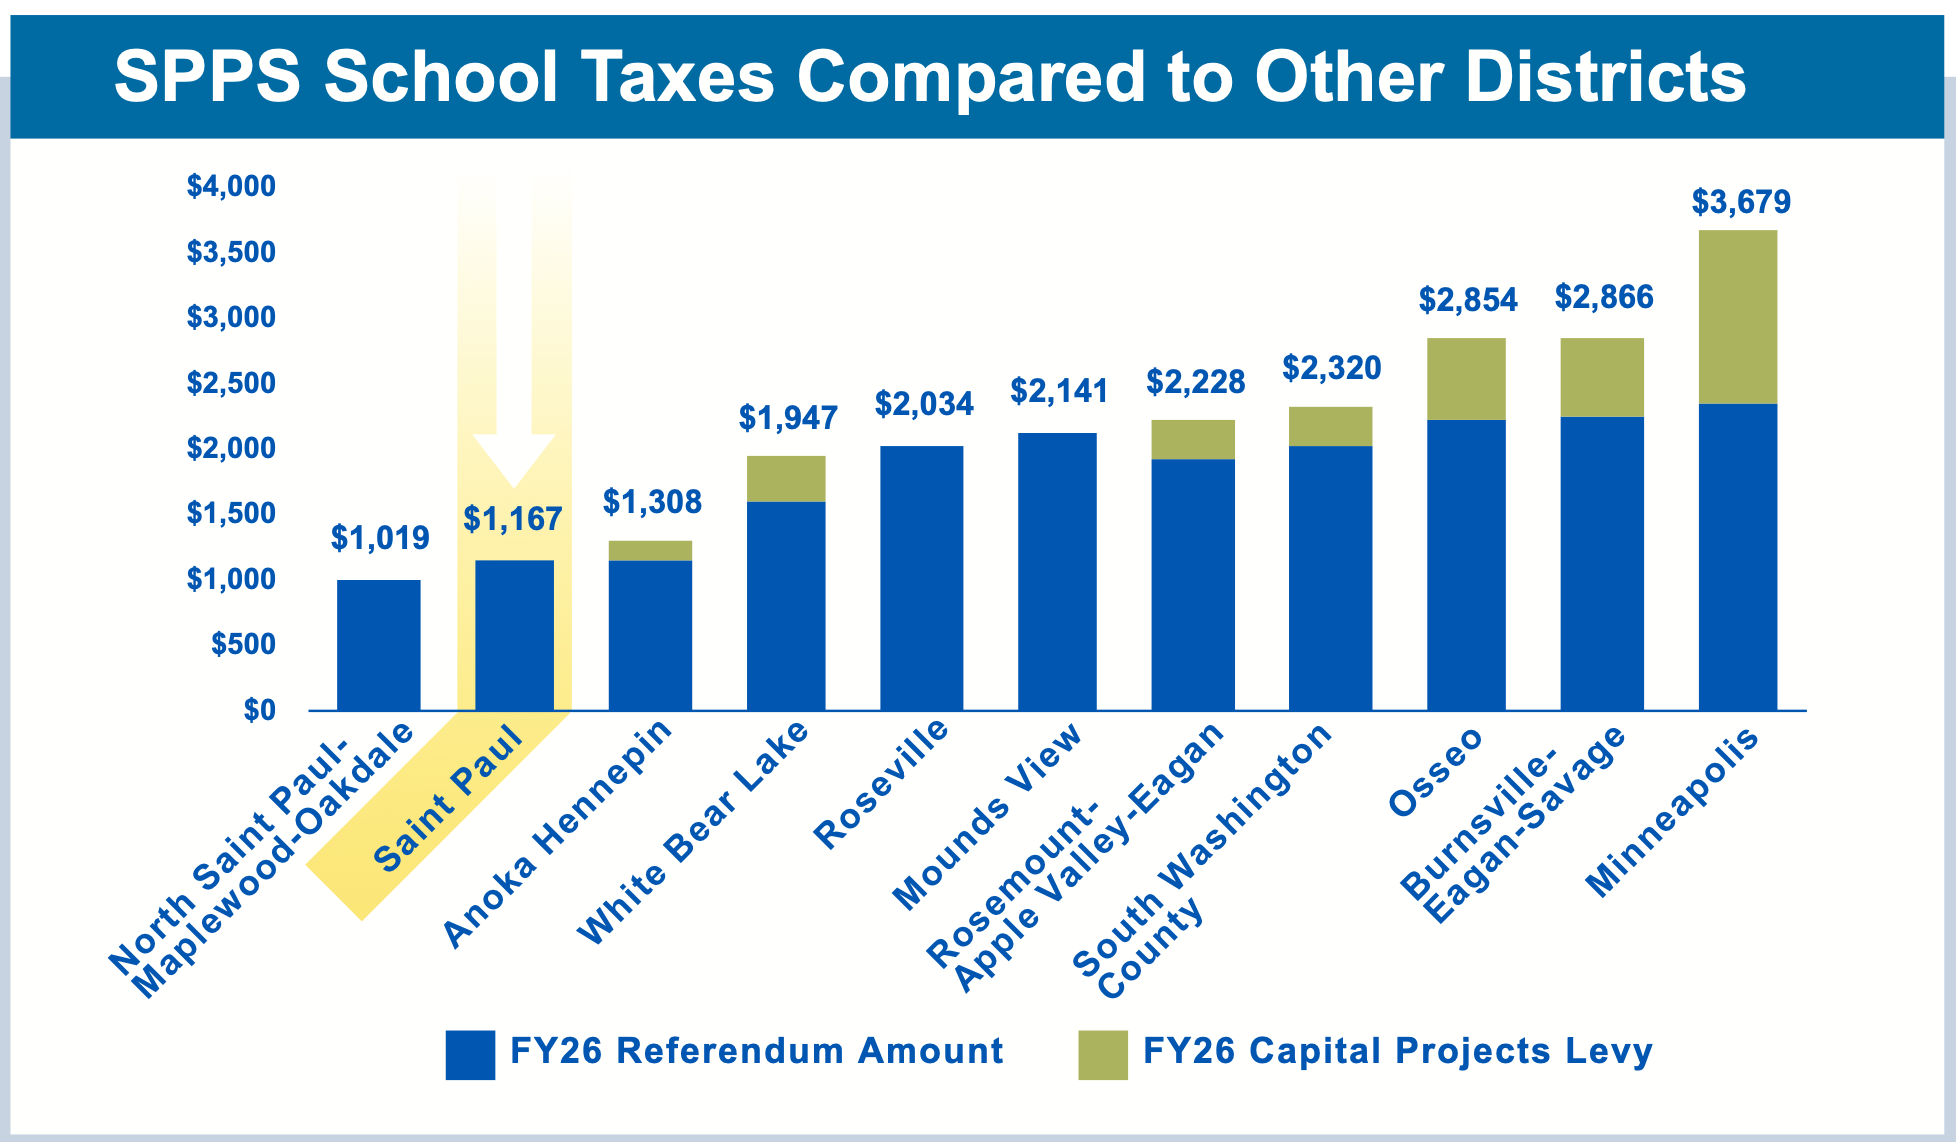
I trust that the numbers are accurate, but feel they are misleading. The point is, school funding comes from many sources, and the ones highlighted in these graphics account for less than 30% of expenditures. It may be true that the State Funding Allowance has not kept pace with inflation, but overall spending (which included local funds, federal funds, and state funds beyond this allowance) has outpaced inflation. Similarly, other districts may have higher local tax levies, but all of the districts shown in the second chart spend less per student than Saint Paul does.2 (I made sure to include all of the districts in this chart in my comparison set for Question 3).
Declining Enrollment is (only) Part of the Story
As mentioned above, inflation-adjusted per-student costs are up 42% over the past 20 years. Some of this can be explained by a 22% decrease in enrollment during that time. If enrollment drops but you have the same buildings and teachers as before, per-student expenditures rise.
However, declining enrollment isn’t the whole story, as total inflation-adjusted expenditures (not per-student) have risen by 11% over that period. In other words, suppose that enrollment increased by 8,000 - 9,000 students overnight, back to 2005 levels. Suppose further that the district managed to add these students without spending a single penny more than it currently does (which is of course an absurd assumption). Even after this miracle, SPPS would be spending 11% more per student than it did 20 years ago.
Buildings are Expensive
As mentioned above, last year SPPS spent over $7,000 per enrolled student on construction and debt servicing. This is approximately 22% of total expenditures.3 For that much money, the district could rent an apartment for 12 months for every two students it supports!
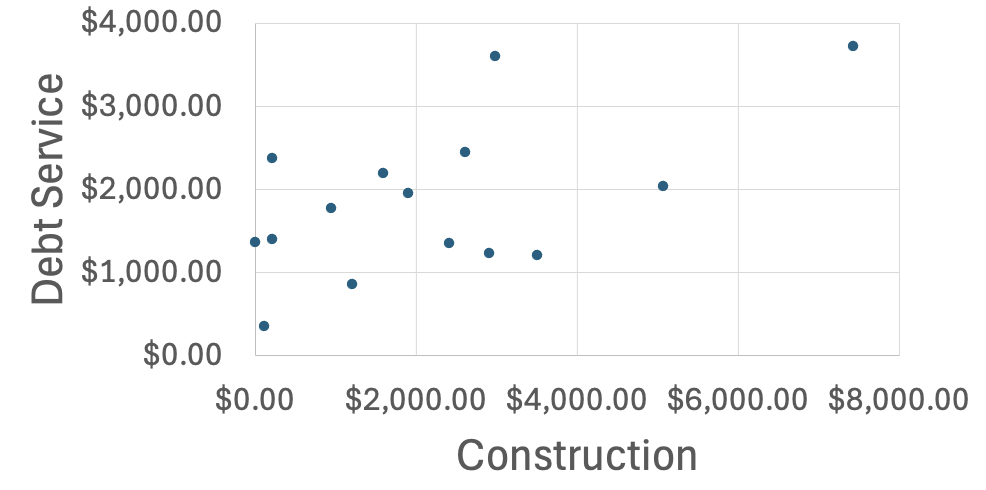
For context, I noticed that spending in this category varies widely across districts. White Bear Lake is currently spending over $10,000 per student on these expenses (upper right corner). Saint Paul is the point roughly at ($5,000,$2,000), while Minneapolis is roughly at ($3,000,$3,600). 10 of the 12 remaining districts are spending $4,100 per student or less.
 In part, this variation is because building construction and major renovation are large expenses incurred infrequently. The $7,000 per student number is a significant increase from the historical norm in Saint Paul. Five years ago, this number was $2,350 (or about $2,900 after adjusting for inflation). Given that construction costs fluctuate significantly over time, one could argue that a fair analysis should amortize current costs over many years of benefits. I will take a rough attempt at this, focusing on the six largest projects (each budgeted to cost over $50 million).
| School Name | Budget | Enrollment | Budget/(30*Enrollment) |
|---|---|---|---|
| Farnsworth Lower School | $90.6 Million | 466 | $6,800 |
| Bruce Vento | $89.9 Million | 442 | $6,800 |
| Obama Montessori | $72.3 Million | 9004 | $2,700 |
| Highland Park Middle School | $56.0 Million | 811 | $2,300 |
| Hidden River Middle School | $54.2 Million | 640 | $2,800 |
| American Indian Magnet | $53.3 Million | 572 | $3,100 |
How I interpret this number: if the enrollment of the school remains constant for the next 30 years, and no additional major renovations are done during this time, the final column is the cost of construction per student-year of instruction. Note that this does not include more routine maintenance costs for custodial services, groundskeeping, utilities, and minor repairs and renovations, which are paid from the General Fund and likely account for much of the $3,400/student going to “Operations Maintenance and Other” and “Capital Expenditures”. In other words, the costs above only account for the cost of creating the building, not maintaining it.
Overall, I am skeptical that this is a good use of money.
All of these projects are on sites that already contained operational schools. I am sure that some of these projects can be justified: repairs to leaking roofs, broken heating systems, etc. But my impression is that existing buildings are fairly functional, and the project highlights from the 5 Year Plan include “Technology Upgrades”, “Sustainability Initiatives and Green Energy”, “Dedicated Specialized Services Facilities” and “Inclusive Restrooms”. Hidden River, which is close to where I live, is getting a grand new entrance and a new parking lot. None of these are bad things, but is this really the best way to spend money?
The plan does state, “The greater the impact to student learning, the greater the need to complete the project.” But what does this mean in practice? The district has done quite a bit to document its process for prioritization, but I don’t see a lot of evidence that this is based on impact to student learning.
How is the Remaining Money Spent?
Special Education
Special Education (SPED) expenses include SPED Teachers, Paraprofessionals, some Psychologists and Social Workers, and SPED Administrators and Support Staff. These expenses come to $4,400 for every student enrolled in the district (more than 3 times the transportation budget). Approximately 19% of students are enrolled in special education. This means that we spend approximately $22,000 on SPED support for each SPED student (in addition to $9,000 for their “regular” teachers)!
I haven’t done a deep dive into how this money is being spent. I believe some of it goes to providing services for SPED students at private schools, which could affect the per-student numbers above. But overall, these numbers seem very high to me: both the number of students enrolled in SPED, and the cost per student in SPED. I am perfectly willing to spend money (even lots of it) to educate students. But when the amounts are this large, it’s important to look more closely and ask the question, “Are we sure that this money is actually helping students learn?”
Instructional Support Services
What are “Instructional Support Services”? My understanding (which is probably incomplete) is that this is primarily money spent on curriculum, professional development, and IT support. This is not nearly as expensive as Special Education, but at $1,100 per student per year, is still nothing to sneeze at.
Based on anecdotes, I suspect that most SPPS professional development has almost no impact on what happens in the classroom. (It would be interesting to survey teachers to see if they agree.) I do believe that professional development can be useful. But making it useful requires a lot of things working together. You need good materials that are aligned with the curriculum and can be incorporated immediately into the classroom. You need teachers that believe in the value of professional development and want to incorporate new ideas into their teaching. And you need enough time and follow-through to make continuous improvement a part of the culture.
For context, my wife has worked in many different settings: a public school on the Navajo Reservation through Teach for America, a Charter School in Brooklyn serving entirely students of color, a wealthy private school in Manhattan, and a Gifted and Talented Public school in Saint Paul. She feels that the Professional Development from Teach for America and at the Brooklyn Charter school were much, much more impactful than anything she has done through Saint Paul Public Schools.
In Teach for America, corps members spent roughly six weeks getting full-time coaching, which included the opportunity to practice techniques under supervision with summer school students. The charter in Brooklyn required staff to return to the building 3-4 weeks before students arrived. Teachers were trained in specific pedagogical techniques, and asked to practice these techniques. During the school year, students were let out several hours early every Friday afternoon so that staff could do additional professional development. Teachers were regularly observed and given feedback. In summary, these schools asked teachers to spend a lot of time providing and/or receiving professional development.
As I see it, the Brooklyn Charter and SPPS have very different models. At the charter school, turnover was very high, and most teachers were quite young. The school compensated for their inexperience by investing heavily in effective training. At SPPS, there are many veteran teachers, so training is both less necessary and less welcome. Teachers are observed less often, and given far less feedback. Trying to adopt the Charter model at SPPS by making more time for professional development seems likely to be unpopular with parents (if the time is coming out of the regular school day) and/or the teachers union (if it is coming out of the summer, evenings or weekends). Furthermore, veteran teachers are likely more resistant to learning new techniques than are teachers in their twenties. But without significant structural changes to how professional development is done, I am inclined to think that the money going to instructional support services is not making a big impact.
District-Based Expenditures
Recall that Saint Paul spends $9,400 per student on “District-Based” general fund expenditures. This includes all sorts of costs, such as district administration, curriculum and professional development, human resources and finance, transportation, etc. Given all these expenses, is $9,400 a lot?
To help put that number into context, I created the following chart, which shows site-based and district-based expenditures per student for each of the 15 districts mentioned previously. Minneapolis and Saint Paul are in the upper right corner.
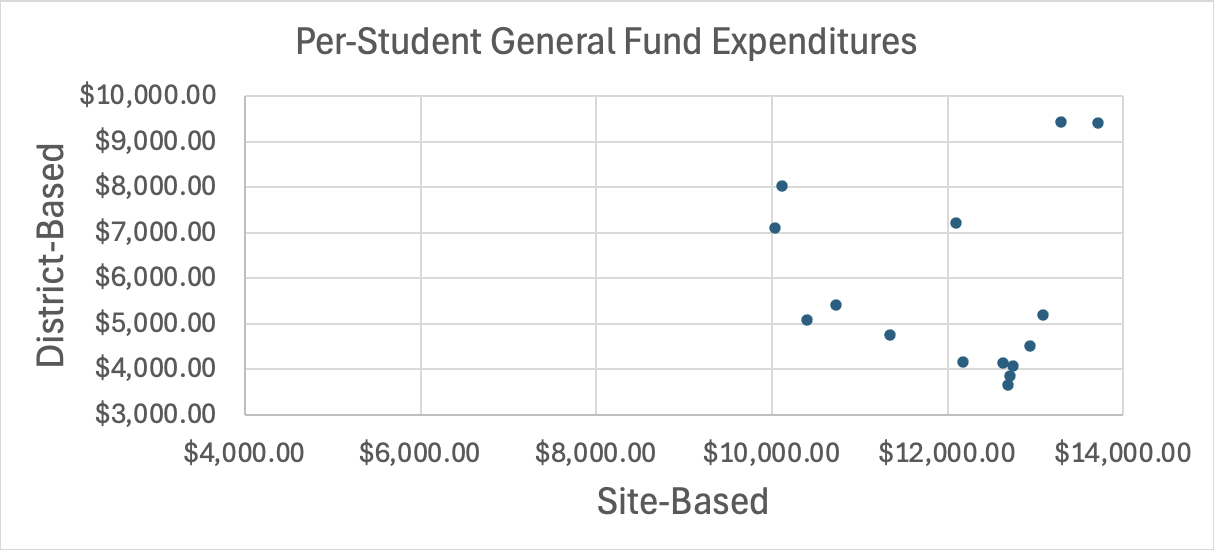
Note that district-based expenditures range widely: from $3,600 to $9,400. In other words, Saint Paul spends more than 2.5 times as much as the lowest-cost district on these expenses (an extra $5,800 per student). The variation in site-based expenditures is smaller: these expenditures range from $10,000 to $13,700.
I’m not ready to draw any conclusions from this, as before I do I would like to do a deeper dive into Saint Paul’s district-based expenditures and why they are higher than those of many other districts. However, that will have to wait for a future post.
Data Sources
My excel spreadsheet showing historical spending and enrollment for SPPS
Data source: Minnesota Department of Education Data Reports and Analytics page.
\(>\) Expenditures - District/Site Level Report. Select desired district, set Year = 2024 and “Run Report” (General Fund Expenditures)
\(>\) Minnesota Funding Reports. Select desired district and set Report = “UFARS Compliance Report” (All Fund Expenditures)
\(>\) Minnesota Funding Reports. Select desired district and set Report = “Historical Adj. ADM Capped at 1.0” (Historical Enrollment)
CPI numbers from Bureau of Labor Statistics “CPI for All Urban Consumers (CPI-U) 1982-84=100 (Unadjusted) - CUUR0000SA0”
SPPS Builds data on construction projects and their costs.
Data on individual school enrollment (I used 2024-2025 figures).
There are reasons we should expect a year of public education to cost less than daycare or college. For example, daycare has much lower child:staff ratios (4:1 for infants, 7:1 for toddlers, and 10:1 for pre-school) than public schools do (my wife regularly teaches classes with 30+ students). And tuition, room and board includes an apartment and all of your meals! \(\newline\) Conversely, it’s important to recognize that this is not an apples-to-apples comparison. Teachers are paid better than daycare providers, and “tuition, room and board” is what the student pays, but not necessarily the actual cost: it ignores additional money provided by the state. Nevertheless, I think these are useful comparisons to make, because most people believe erroneously that daycare and college are much more costly than primary and secondary school.↩︎
There may of course be valid reasons for different levels of expenditures across district. I am sure that many people will say that Saint Paul needs to spend more because it has older buildings or higher rates of students with special needs. These points deserve a longer response than I will give them here. Based on a quick look at the data, these factors account for some of the differences in spending, but not all of it. Regardless of the reasons, I think it is at least good to be aware that Saint Paul is spending more than other districts.↩︎
The district regularly claims to spend 80% of its money on salaries, but this is misleading because it means 80% of the general fund, and completely ignores other funds (construction, debt servicing, and food service) which are largely non-salary expenses.↩︎
This building contains an Elementary School and a Middle School, each designed for approximately 450 students. Currently, the Middle School only enrolls 6th grade students. I am being generous by assuming the Middle School will soon be at its capacity. ↩︎